Some readers asked me to write about my asset allocation and rebalancing thresholds. Here I introduce my Cascading Asset Allocation MethodTM (CAAM). I googled and I found no evidence of anybody else using that term. So I’m claiming a trade mark on it. 🙂
The Cascading Asset Allocation Method involves answering a series of questions. The questions go from the most important to the least important. You can stop anywhere along the way and you will still have a reasonable asset allocation. The best part of it is that you will understand why you end up with a particular allocation.
Because a picture is worth a thousand words, here’s how the method divides up the asset allocation decisions into a series of splits.
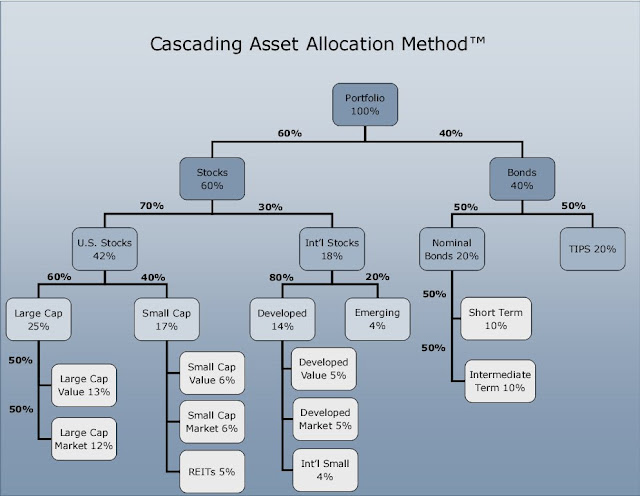
You decide how much weight you assign to each arm. The numbers in the picture are what I would use for my allocation if I go all the way to the bottom on each branch, which I don’t always do. For instance right now I don’t split US small cap; everything is in US small cap value. Nor do I split international stocks; everything is in a total international stock market index fund. I’m also flexible in fixed income: I have munis, CDs, and I Bonds.
The higher level splits are more important than the lower level ones. As you go toward the bottom, the splits make less and less difference. At any point, if you are not sure what weights to use, just stop, don’t split it. More complexity isn’t necessarily better. You might as well stop somewhere in the middle.
Here are some examples of the same allocations but not splitting all the way down to the bottom.
| 1 Fund | 100% Vanguard LifeStrategy Moderate Growth (VSMGX) or 100% Vanguard Target Retirement 2015 (VTXVX) |
| 3 Funds | 42% Vanguard Total Stock Market Index Fund (VTSAX or VTI) 18% Vanguard Total International Stock Index Fund (VTIAX or VXUS) 40% Vanguard Total Bond Index Fund (VBTLX or BND) and/or Vanguard Intermediate-Term Tax-Exempt Fund and/or CDs |
| 6 Funds | 25% Vanguard Large-Cap Index Fund (VLCAX or VV) 17% Vanguard Small-Cap Index Fund (NAESX or VB) 14% Vanguard Tax-Managed Int’l Fund (VTMGX or VEA) 4% Vanguard Emerging Markets Stock Index Fund (VEMAX or VWO) 20% Vanguard Total Bond Index Fund (VBTLX or BND) and/or Vanguard Intermediate-Term Tax-Exempt Fund and/or CDs 20% Vanguard Inflation Protected Securities (VAIPX) and/or individual TIPS and/or I Bonds |
Now, let me explain briefly how I came up with my set of weights on the arms.
Stocks vs Bonds. Rule of thumb is (100 – age)% in stocks. Benjamin Graham said one should start with 50/50 and adjust up or down between 25% in stocks and 75% in stocks. I chose 60%, slightly above 50/50.
U.S. vs International. John Bogle said 20%. Some others said 30%. World market is 50%. I chose 30%.
Nominal bonds vs TIPS. 50:50 sounds good but I’m flexible.
U.S. Large vs Small. Market is about 20% in small. I chose 40% in small because I work for a large company.
Developed Countries vs Emerging Markets. Market allocation is 20%. I went along with it.
Growth vs Value. Because I work for a growth company, I chose to have more investments in value funds. Since a “blend” or “market” fund includes both growth and value, 50% market 50% value is like 25% growth 75% value.
If you want to learn more about asset allocation, you’ve got to read William Bernstein’s excellent book The Intelligent Asset Allocator.
For rebalancing, see +/- 5% Rebalancing Bands.
Say No To Management Fees
If you are paying an advisor a percentage of your assets, you are paying 5-10x too much. Learn how to find an independent advisor, pay for advice, and only the advice.
Ted says
Thanks for posting. Very interesting. I like your picture.
What is the difference between the international funds you listed above and the Vanguard Total International Index (VGTSX)? Why wouldn’t one just use VGTSX since it contains EMs?
PS – I did the survey
Anonymous says
Just came across your site today, lots of great info, I really appreciate your work here.
Could you discuss why the fact that you work and live in the US doesn’t (or maybe it does) factor in to your Int’l/Domestic allocation?
Intuitively I would think this should have a bigger impact on your Int’l allocation than you’re factoring your employer into your Lg/SM and Gr/Val allocations.
Any response would be greatly appreciated. Thanks in advance.
Harry Sit says
@Ted: First thanks for filling out the survey. I’m going to use the FTSE All-World ex-US fund because it has everything, including Canada. I think it’s a little better than VGTSX because the FTSE fund is supposed to reach deeper into smaller stocks. If I wanted to have either more or less emerging markets than the market has (more EM risk or less EM risk), then I’d split it into one for developed and one for EM.
@anon re: US/international for someone living and working in the US. I’m not immune from the “home country bias.” I think the world is becoming flatter though, at least for the large companies which dominate both the US and international indexes. If the economy outside of the US does better, the US companies also benefit. If the US tanks, the international companies also suffer (cf. North Rock in UK). The cost of investing in the US market happens to be lower. So I didn’t go overboard in loading up on my international allocation.
Harry Sit says
Make that Northern Rock, not North Rock.
Brad says
Interesting. Thanks for posting it, TFB. I’m more interested, really, in your rebalancing triggers, but it’s also good to compare allocations. I’m far more aggressive than you in my stock/bond allocation, but less aggressive within my stocks (less small, less international, no REIT). I intend to tilt small, but according to morningstar I’m not doing a good job (10% small– odd, because according to Vanguard I am 21% small). Anyway, thanks again and I look forward to seeing info about your triggers.
Anonymous says
I like the picture, but I would argue that REITs are not a stock, or a bond, but rahter their own, third asset class. As such, I think that the decision to exclude them from a portfolio is unwise. I do not see how a REIT is an equity (though I wishe their dividend streams were taxed that way…)
Harry Sit says
@Anon, re: REITs. Some experts, like Burton Malkiel, author of A Random Walk Down Wall Street, puts REITs at the top level as a separate asset class together with stocks and bonds. I still put it in stocks because I think REITs are an industry sector and a corporate structure. I’ve seen regular C-corps converting to REITs and REITs converting back to C-corps. If a stock and a REIT can convert to each other, REIT feels like a stock to me. It just happens to be a stock in the real estate industry.
CanadianInvestor says
Good site, just came across it. Like your method and logic – how could I not as it is very similar to mine.
Re REITs and asset classes, to me anything can be another asset class, as long as it provides diversification by being un- or negatively-corrleated with other asset classes.
Matt says
Hi,
Nice work. I linked in via Diehards. Was the cascade model made via PowerPoint? The graphic is more powerful than a simple table and would like to use something similar for my own portfolio breakdown.
Matt
Harry Sit says
Matt – It was made with an org chart template I found here.
Matt says
Thanks.
Unfortunately, I don’t have Microsoft Publisher so I can’t download the template or open the .pub file.
Matt
Samples says
Multi part post:
1) Shouldn’t REITs now be considered basically the same as large cap stocks? As an economy suffers, real estate net income and valuations suffers. As an economy surges, net income and values take off. I work in commercial real estate and am feeling the painful effects of this right now. I guess the only thing that might somewhat differentiate REITs in my mind is the ‘hard asset’ aspect of real estate. As the saying goes, ‘they haven’t figured out how to create more land’ and fixed material / construction costs will usually provide somewhat of a floor for what landlords will be willing to rent or sell for.
2) Where can the ‘market’ percentages for the major market segments you reference above (intl, small cap, emerging, etc) be found and updated on a regular basis?
3) I’m part way thru Graham’s book and correct me if I’m wrong, but the message I took was move towards 25% stocks when the markets are overheated (last year) and if you’re willing to take the risk, move towards 75% when you think its undervalued (now). In hindsight it seems silly to have not realized the market was overheated in 2007, but most of us didn’t. For simpletons, what few market indicators would be the best evidence of over / under valued equity markets and where’s the best place to get the data? My guess is following market P/E ratios is the one factor most people would follow to make that determination.
4) Lastly, if you take the last question a little deeper and analyze the market’s major sectors, would it make sense to keep your overall asset allocations stable but buy some sort of hedge or short fund against an overheated sector? I’m not even sure where to find that fund, but using history as an example, it would have been great to stay invested in the late 90’s, but be hedged against tech. Is this practical for a mostly passive index investor? As much as proponents of passive index investing preach that you have to pick an allocation and stick with it at all times, some high level strategic shifts seem to make more sense than just staying put at all times.
Thoughts?
Great site by the way….
Harry Sit says
Samples – 1) I think REITs are still different. Evidence: they dropped a lot more than large caps in the last two years. You hope they will go up a lot more.
2) You can look at the allocation in the “total” indexes. For example Vanguard Total World shows the market percentages for US/international and developed/emerging markets. US large/small depends on where you make the cutoff. This S&P 500 fact sheet shows the total market cap is $6,927 billion. This S&P Total Market Index fact sheet shows the total market cap is $9,491 billion. That means 73% large, 27% small.
3) Yes Graham did say that. I haven’t figured out what are the reliable indicators yet. If it were that obvious, the market wouldn’t have gotten overvalued in the first place because everybody would know. So I will be a defensive investor as defined by Graham.
4) We have ETFs for almost every sector. You can certainly short the hot sector if you want to. I’m not that brave though. I’m doing my version of hedging by staying more on the value side. But then we get into the current situation where financials looked like value but they are really not. There are no easy answers.
SV says
I am assuming this is for your retirement. How does your allocation look for college tuition or other shorter term goals? In general, can you shed some light on time horizons and their impact on asset allocation?
Harry Sit says
SV – Shorter time horizons = more conservative on the top stocks/bonds decision branch. Then it cascades down as usual. Stop when it doesn’t make sense to spread too thin. If it’s less than five years, I would just do CDs or the equivalent. Five to ten years, maybe 20% stocks, 80% short term bonds. 10 to 20 years, 40% stocks, 60% bonds? The conservative option of age-based portfolios in Vanguard’s 529 plan for Nevada looks sensible to me.
Graham Myers says
Very similar concept to the paper I presented in Namibia a few years back which I termed Cascading Fund allocation. The same thing worked with budgets and variance. Set up in emerging companies and small and micro businesses it helps to balance expenditures and revenues from the first month. The need for a complex accounting system is also eliminated. Give me a shoult if you want the paper.
Sam R says
I have just read this again. Very nice chart, Harry. Thank you. Currently I only have 2.7% of total asset in long term bonds. In today’s environment, it’s not wise to buy more long term bonds, right?
Harry Sit says
I don’t have any long term bonds in my chart.
Sam seattle says
Since you’ve exchanged your REITS to PME, are we going to get an updated chart? By the way, it’s a very nice chart.
Ben says
Great chart, is it possible to be customized?