You probably heard lately investors found religion in indexing. Money is coming out of actively managed funds and going into index funds and ETFs. After Vanguard’s Personal Advisor Services and Schwab’s Intelligent Portfolio, Fidelity also came out with its Fidelity Go service, which uses index funds. It’s great to see more and more people move into indexing for its simplicity and low cost.
Why would someone even consider investing in actively managed funds then? Besides being misled by an advisor/salesperson who sells actively managed funds for commissions, or when a 401k plan doesn’t offer index funds as investment options, investors choose actively managed funds when they want to beat the market. Whether they are actually able to do so depends on the funds they choose.
I have been with my current employer for more than 10 years. My employer’s 401k plan offers both actively managed funds and index funds. I remember seeing these two funds on the menu when I first joined:
- Dodge & Cox Stock Fund
- American Funds EuroPacific Growth Fund R6
They are still on the menu today. With no load, an expense ratio in the 0.5% range, and a Gold medalist rating from Morningstar, they can be considered as good actively managed funds. For curiosity I took a look at what if I invested in these good actively managed funds as opposed to index funds in all these years.
I didn’t just pull the 10-year average returns from Morningstar. I wanted to see what if I invested a set percentage of the annual 401k contribution limit into these two funds every year. Because I only had annual returns data, I had to simplify and assume the money was invested at the beginning of each year.
Dodge & Cox Stock Fund
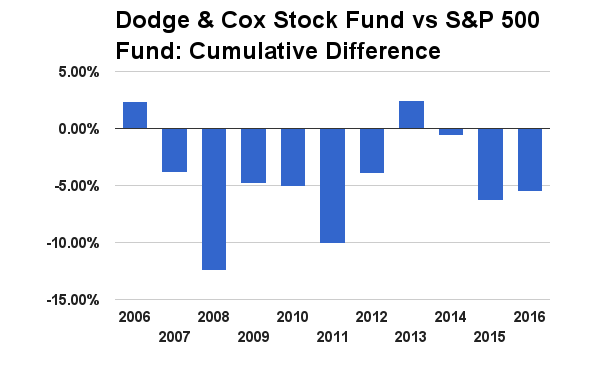
This chart below shows the performance difference in each year between Dodge & Cox Stock Fund and the S&P 500 fund on the menu.
Above zero means Dodge & Cox Stock Fund did better than the S&P 500 fund. Below zero means it did worse. Dodge & Cox Stock Fund did better in about half the years, worse in the other half the years. Although they both invest in U.S. large cap stocks, the difference can be quite large from year to year. In 2008 Dodge & Cox Stock Fund was 10% worse than the S&P 500 fund. In 2013 it was 6% better.
This second chart shows the cumulative effect through the end of each year:
Again above zero means investing in Dodge & Cox Stock Fund did better through the end of that year. Below zero means investing in it did worse. If I invested in Dodge & Cox Stock Fund every year since I joined the company, I would be worse off than if I invested in the S&P 500 fund most of the time. I came ahead briefly in 2013 before I lagged behind again. By now I would be about 5% behind, which happens to be about the same as the difference in expense ratios accumulated during these years.
American Funds EuroPacific Growth Fund
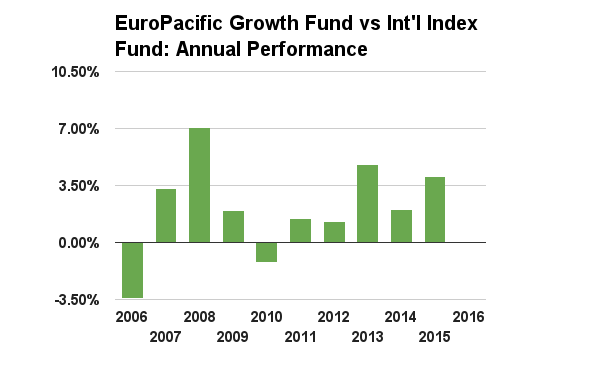
This chart below shows the performance difference in each year between American Funds EuroPacific Growth Fund R6 and Vanguard’s total international stock index fund. The R6 share class is only available in 401k-type plans. It has no load and the lowest expense ratio for this fund.
Above zero means American Funds EuroPacific Growth Fund R6 did better. Below zero means it did worse. The bar for 2016 (as of mid-September) doesn’t show because it’s near zero. American Funds EuroPacific Growth Fund R6 did better than the index fund in most years.
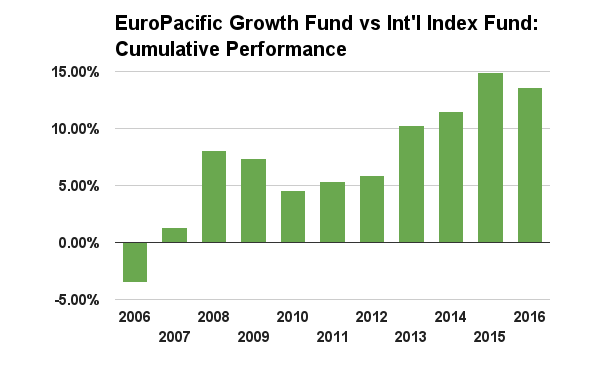
This second chart shows the cumulative effect through the end of each year:
Again above zero means investing in American Funds EuroPacific Growth Fund R6 did better through that year. Below zero means investing in it did worse. If I invested in American Funds EuroPacific Growth Fund R6 every year since I joined the company, I would be better off than if I invested every year in Vanguard’s total international stock index fund. By now my balance would be about 14% ahead even after paying a higher expense ratio every year.
***
Here we have two evergreen actively managed funds in my 401k, one behind and one ahead of their index fund alternatives. Coincidentally if I did a mix of 70% Dodge & Cox Stock Fund and 30% American Funds EuroPacific Growth Fund R6, I would be about dead even as the same mix using index funds.
Lessons
What does this exercise show? It shows index funds don’t always win and you can pick a winning fund ahead of time, if only by luck, but it’s hard to score a win overall. These two funds in my 401k plan are probably the 401k committee’s better choices because the more obviously bad choices would’ve been replaced already (see 401(k) Committee Chasing Performance). When you already have index funds as options, be prepared to fail when you take a chance at beating the index funds.
On the other hand, it also shows you are not doomed if you only have actively managed funds in your 401k plan. Investing in two good actively managed funds would’ve got me to about the same balance as investing in index funds. Contributing the maximum and investing with a sound asset allocation are more important, especially when these days most people don’t stay with the same employer for 10 years. When you switch jobs, you can rollover the 401k money into your IRA and invest in index funds there. Even if the funds in your 401k are bad, the negative impact is limited because you won’t have a lot of money in them for many years.
Learn the Nuts and Bolts
I put everything I use to manage my money in a book. My Financial Toolbox guides you to a clear course of action.


msf says
D&C is a value shop, and their stock fund is a value fund. Value funds as a category have underperformed the market as a whole over the past decade. One gets a better picture of this fund’s performance by comparing it to a value index. Morningstar recommends using the Russell 1000 Value total return index.
Relative to that index, D&C underperformed by 0.64%/year over the past three years, but outperformed by 0.82%/year over the past five. (It also outperformed the S&P 500 by 0.66% over the past five years.)
On average, it underperformed by 0.30% over the past ten years. Long term (15 years – as far out as Morningstar shows), D&C beat this representative benchmark by an average of 0.80%/year.
This shows that picking the right benchmark matters, and that time frame matters as well.
Had you joined the company five (or fifteen) years ago instead of ten, you possibly would have done better with the D&C fund than with the S&P 500 fund. (I only say possibly because I haven’t done the annual contribution calculation to get cumulative figures.)
A question on the data: Morningstar shows D&C total return of -43.31% for 2008, with the S&P 500 total return index losing “only” 37.00%. (Presumably your S&P 500 fund did worse than that, since it had expenses to pay, e.g. Vanguard 500 VFINX lost 37.02%.)
That’s a difference of just over 6%, but the graph shows a difference of about 10%.
I agree that good, inexpensive actively managed funds can do well in one’s portfolio – especially in a tax-sheltered one where it is easy to switch if the management changes. I’m just not entirely comfortable with the data.
Harry Sit says
$1,000 down 43.31% is $566.90. $1,000 down 37.02% is $629.80. $566.90 / $629.80 = 0.90, i.e. you would have 10% less money in Dodge & Cox Stock Fund than in the S&P 500 fund at the end of 2008 if you invested $1,000 at the beginning of the year.
Sam S says
Good point, Harry.
TJ says
Shouldn’t you compare EuroPacific Growth to the Developed Markets Index fund? Would the results be any different considering Total International is loaded with the more volatile Emerging Markets?
Harry Sit says
It has > 20% in emerging markets.
msf says
There are various problems with the comparison, but too much emerging market in Total International isn’t one of them. EuroPacific Growth currently holds 22.44% in emerging markets, which is actually more than Total International’s 15.57%.
The main problem is that EuroPacific GROWTH is a growth fund not a blend fund (similar to the problem comparing D&C Stock to S&P 500). Morningstar’s benchmark of choice is MSCI ACWI (all country world index) Ex USA GROWTH index
https://www.msci.com/documents/10199/86ba2cf4-771c-4ec2-985f-076c795ebbe5
A petty problem is that the R6 share class has not existed for the full ten years. Can’t tell if the earlier performance came from R5, or was hypothetical (based on R5 performance but adjusted for expense ratio differences). Just a distraction, as the difference in expenses between R5 and R6 is just four basis points (0.04%).
Harry Sit says
msf – When you choose actively managed funds, you delegate the degree of value or growth to the managers. They are supposed to see whether value will do better or growth will do better and lead you there. Both the Dodge & Cox fund and the American Funds fund set a broad index as their own benchmark. They strive to beat the S&P 500 and MSCI ACWI ex USA index respectively, not just the value or growth sub-index. I think it’s fair to evaluate them on such effort.
I didn’t check when our plan switched from R5 to R6. In my chart I took the performance numbers from A shares without load and adjusted for the expense ratio difference. I don’t think it makes much difference.
Millennial Moola says
Long time investor in Vanguard’s healthcare fund, have to say I’m pretty pleased with the results and wish I’d left everything in there instead of diversifying
msf says
I guess we just read things differently.
When I see one fund grow by $10 and another grow by $20, starting from the same base, I’m inclined to say that the latter did twice as well (100% better). Your calculation would say that you couldn’t tell (insufficient info):
The fund might have done 50% better (if both started with $10, growing to $20 and $30 respectively), or it might have done 9% better (starting with $100), or it might have done 1% better (starting with $1000).
When I read a prospectus that says the fund invests in stocks that are undervalued, when it says that it looks for low P/Es, low P/Bs, low stock price relative to underlying assets, I don’t think: hey, here’s a fund where the managers can invest in growth stocks if they want. Even if, for reference purposes, the fund offers a “relevant _broad-based_ market index” that includes growth stocks. (This is all from T. Rowe Price Value Fund’s prospectus TRVLX.)
D&C Stock fund prospectus similarly talks about how it invests in stocks that appear to be temporarily undervalued. EuroPacific Growth fund prospectus says that the fund invests in stocks that have the potential for above-average capital growth. It talks about the risks of growth-oriented investing (but doesn’t say that the fund takes on any value-oriented investing risks).
You suggest that these funds are free to invest in any style of stock, and so compare them with wide ranging indexes. I see how they’ve described their investing styles and I expect the funds to hew to them. We just read things differently.
louis c says
Most folks agree that they can’t beat the market by picking individual stocks. So they are willing to pay professionals to do it for them by investing in mutual funds with high fees. The problem is that most of the pros don’t beat the index. To beat the market, you have to pick the right mutual funds, which is just as difficult as picking individual stocks. Why waste your time and money?
Sure, if you are “forced” to use an active fund, try to find one with low fees and a decent track record (by which I mean staying close to their benchmarks). But lets not make a bunch of excuses for the fund managers. If what they were doing actually worked, they’d beat the market routinely, not randomly.
Brad says
@louis c is of course correct. The only “fund manager” who has consistently beaten the market is Warren Buffet, along with maybe ‘can count on one-hand’ some others less well-known. The operative word being “consistently” … in fact even Buffett knows his talent is essentially so unique as to be non-existent in the world of fund managers, and he put (a relatively small amount of his net worth, admittedly) his money where his beliefs lie, in this bet: http://longbets.org/362/#adjudication_terms (You can see him discuss this bet at his shareholder meeting this year, starting at the 2:42:20 mark here: https://finance.yahoo.com/brklivestream/ and he does mention Sequoia Fund as–originally–having some decent managers, though even their record since 2011 has been dismal.)
I will say that even BRK as a stock has done worse than the S&P500 during the period of the bet, returning only 39.5% to the (Vanguard index for the) S&P 500’s 65.7%, although the hedge fund of funds used in the bet have done only half as well as Buffet & Co. at 21.9% (though I actually calculated it at about 20%, not almost 22%)…