
The start of a new year is a good time to recap the previous year and plan for the current and future years. My wife and I just did the annual financial review for our household. I’m sharing the template we use and where we get the data.
Net Worth
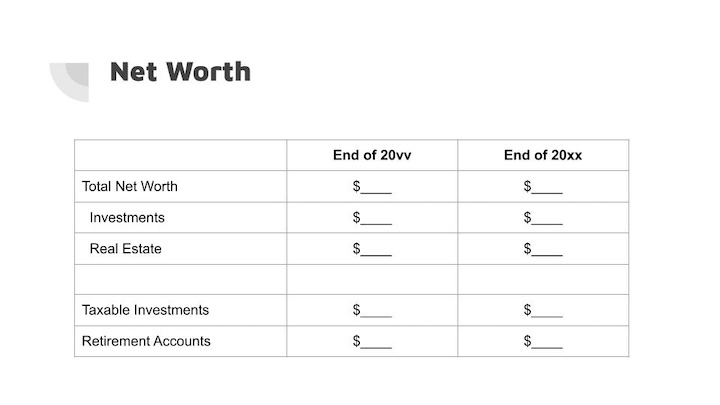
The total net worth represents all financial resources available at a point in time. We break it down into two categories: liquid investments (“paper assets”) and real estate. The value for real estate is net of any mortgage balances. We include home equity in total net worth because it is an available financial resource. We love our home, but when necessary, we can sell and buy a less expensive home or use the proceeds to fund assisted living. We use the historical purchase cost as the value for real estate. You can also use the property tax assessment value or a reasonable estimate.
We further break down liquid investments between taxable investments and retirement accounts. You can add a third category to break out Traditional versus Roth accounts if you’d like.
We get these values from Fidelity’s Full View, which aggregates both Fidelity and non-Fidelity accounts. I updated my post Fidelity Full View + Analysis: Track Your Portfolio Across All Accounts with Fidelity’s latest user interface, also known as the New Full View. The New Full View doesn’t have all the features of the Old Full View, but it still works for our purpose.
We round to the two most significant digits in these numbers. $1.3 million or $250k is good enough. It’s not necessary to go more granular.
Investment Allocation
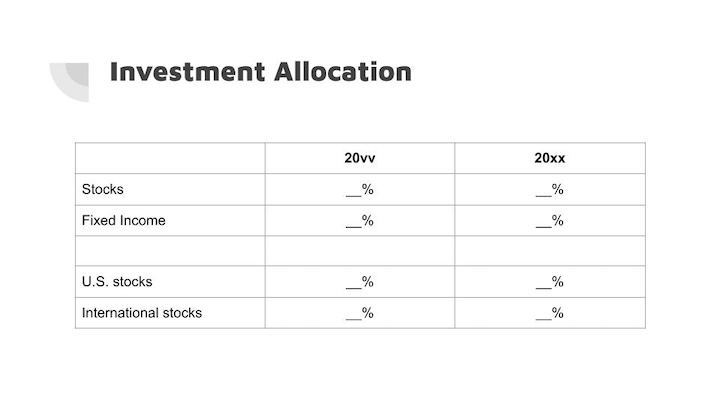
Next, we look at the investment portfolio’s asset allocation at the highest level: stocks versus fixed income, and U.S. stocks versus international stocks. This tells us how it changed from the previous year and whether we need to rebalance.
We get these numbers from Fidelity’s Analysis feature, which I described in the second half of Fidelity Full View + Analysis: Track Your Portfolio Across All Accounts. Analysis examines the investment holdings from all accounts in Full View. You can use other tools or a spreadsheet.
Income
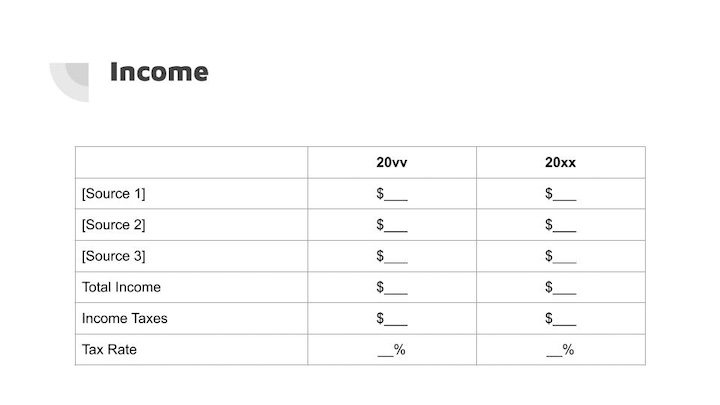
This is our tax return boiled down to its simplest form. What are the major sources of income? How much do we pay in taxes? How much is it as a percentage of our total income?
We get the income numbers from Microsoft Money, which was discontinued many years ago but still runs in Windows 11. Any other income and expense tracking software works as well. Taxes for the prior year are from the actual federal and state tax returns. Taxes for the year that just ended are estimated.
Again, use no more than two most significant digits, as in $25k, not $24,736.
Expenses
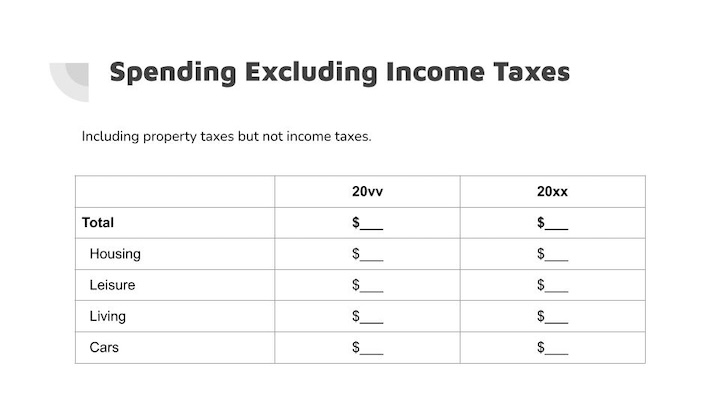
Now we come to the expenses side. We include property taxes but not income taxes as expenses. Income taxes are largely a function of income. The quickest way to lower taxes is to lower income. Income and taxes are already covered in the previous section.
We keep income and expenses in only three or four major categories. Fewer categories present a clearer view without distraction from too many details. The expenses data also come from Microsoft Money. Again, many other income and expense tracking software work too.
Baseline Retirement Projections
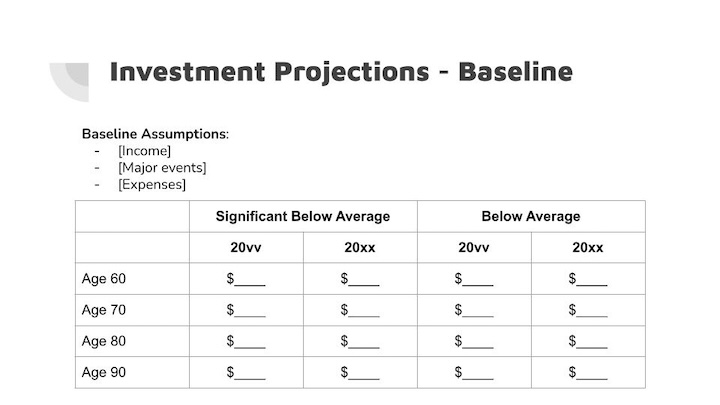
We run a baseline projection in Fidelity’s retirement calculator. I updated my post, Fidelity Retirement Planning Tool: High-Level Model, Not Tactical, with Fidelity’s latest user interface. The retirement calculator uses accounts in Full View assigned to the retirement goal.
The baseline assumptions include our best guesses for income, expenses, and major events. The retirement calculator projects a trajectory of the investment portfolio when market returns are significantly below average or merely below average. I look at the projected values in today’s dollars at major age milestones. Comparing with projections from last year tells us whether we’re off track.
Projections by definition are educated guesses. Anything beyond the single most significant digit in the numbers is meaningless.
Pessimistic Retirement Projections
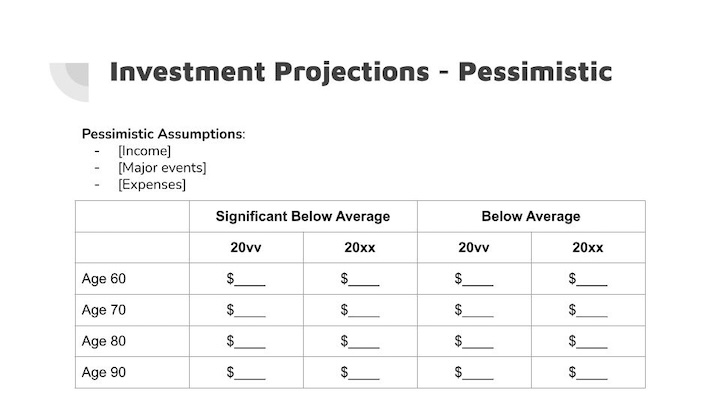
We run the projections again in my wife’s account with a more pessimistic set of assumptions: lower income, higher expenses, and unexpected events. We do it in two accounts because Fidelity’s retirement calculator doesn’t allow saving two scenarios in one account.
The pessimistic assumptions serve as a stress test for the future outlook. What if our best guesses are off significantly? We want our plan to survive these adverse conditions. Running these projections revealed the two fundamental drivers of financial success in retirement.
Summary
Finally, we summarize the previous sections. This recaps the previous year and guides the current year.
We intentionally keep the annual financial review short and simple because we believe it’s most useful to have a big picture. We use Fidelity’s tools and Microsoft Money as data sources, but you can also populate the review with data from other sources.
If you find this format helpful, you can download the template from Google Drive. It’s set as view-only. Please use File -> Download to download it in PowerPoint or ODP format and modify it as desired.
Learn the Nuts and Bolts
I put everything I use to manage my money in a book. My Financial Toolbox guides you to a clear course of action.
Art says
Do you include life or long term care insursnce amounts in your net worth?
Harry Sit says
I don’t have life insurance or long term care insurance, but I wouldn’t include those in our net worth. Life insurance enters net worth after it pays out. Long term care insurance reduces expenses if and when it covers those expenses.
DIY says
Thanks for all you do! Always appreciated and happpy 2026. You probably know this but while you can’t save 2 scenarios in Fidelity Retirement Planner while you save the report as a PDF you can check all 3 outcome options so you have in digital or hard copy. I am very frustrated and disappointed that Fidelity keeps dumbing down and taking away info, data and reports that we used to have at our fingertips. I assume a ploy to get more customers to use a FA and AUM. I do have one but am still DIY and just do a quarterly zoom with her as a checkpoint and to have her send me the full retirement plan report!
Indra says
I like the simplicity of the review. Thank you for sharing.
Jim M says
Good suggestions Harry. I appreciate what you do for all of us DYIer’s. Another feature that Fidelity Full View offers is the “Spending” tab, which we recently used for our annual review. I used to use Personal Capital (which became Empower). We don’t budget but do keep track of our spending each month. I like how easy it is to set “rules” for how transactions are characterized in Full View. Sometimes when the transactions are downloaded from our bank they get assigned to the wrong type of expense category (checks too don’t reflect who the payee is). Each month’s new transaction gets put in the correct bucket once the rule is set. That was a problem for me with what we used before. We track our expenses in a bit more detail than it sounds like you are doing and the Full View Spending tab helps us.
Harry Sit says
It’s great that the Spending part of Full View works well for you. I suggested ignoring the Spending part in Full View because it doesn’t work for many people and trying to make it work is like putting a square peg in a round hole. If it works, great. If it doesn’t, don’t fight it. Tracking budget and spending isn’t a strength of Fidelity or eMoney.
KD says
Harry, excellent article. I am curious about the retirement scenarios check especially, the pessimistic outcome. I am assumed that at your level of wealth, when one accounts for future income streams such as Social Security and a TIPS ladder that the retirement is essentially 100% funded. And the positive returns over long term from stocks for the remainder funds the one off expenses with Home equity funding Long Term Care if there is need and there is no insurance policy for it. So what/how does the pessimistic outcome help/inform you?
Harry Sit says
The pessimistic outcome informs us boundaries or redlines. For instance, a previous run showed that increasing the annual spending by 25% year after year coupled with significantly below average market performance would put us in a situation we don’t like. I wrote about it in Two Fundamental Drivers of Financial Success in Retirement. We can have one or the other, higher recurring expenses or bad returns, but not both, whereas a one-off spike such as paying 50% more on a home purchase doesn’t affect us as much. It tells us what to worry about and what we shouldn’t be too concerned with.
erik says
Hi Harry, I have a question for you regarding Microsoft Money you reference. I have used Money since its launch in 1998. I currently use version Microsoft Money 2006 Standard Addition ( V 15.0.80.513) on my laptop with Widows 11. I had to install the software from a CD I still have using an external CD drive. I have never upgraded to the “MoneyBizSunset” version that I have stored (the *.exe). Q1.) What version are you using? Q2.) Do you have any secrets with how you maintain your *mny data file? Q3. Do you have any other insight?
Harry Sit says
I’m using the Sunset edition. Some banks still offer transaction downloads in Quicken format. Microsoft Money can use import downloads with some tweaks. See Import Quicken Downloads To Microsoft Money. I use PocketSense to download share prices to update investment values. Other than these, I enter transactions manually.
https://sites.google.com/site/pocketsense/home/msmoneyfixp1
Art says
Is Microsoft Money still safe to use & implement with no more security updates from MS?
Is it free to download the software? Where to find it? Thanks.
I have been using my own spreadsheets and download stock prices from Google every Friday after markets closed.
Harry Sit says
I use Microsoft Money only because I have used it for a long time and it’s still working. It’s no longer on Microsoft’s website. You can find installers on archive.org.
https://archive.org/details/MSMoneySunset
I can’t speak to how safe it is. I can only say I haven’t run into any problems. It doesn’t download anything by itself. It only imports files that are already downloaded by other means.
Most new generation money tracking software offer a free trial. I’ve heard of Monarch Money and Copilot Money, but I have no personal experience. Watch some YouTube videos and try them to see which one you like.
Matt says
Thank you for posting this. I’m curious Harry how you or others have found the new Fidelity Full View introduced at the start of 2026? It is significantly worse in my opinion for seeing the full picture of assets and liabilities, with tabulations by account holder. In the past this was possible on the Net Worth – Report section, and you could cleanly and easily see everything at on one screen. Additionally, there was a Net Worth History screen that gave you history per month with a graph. You can no longer get that information now – there is a graph and table offering, but its on a daily basis that is paginated and requires scrolling through lots of pages – and no ability to download it either 🙁
Harry Sit says
The New Full View still works for the purpose I use it. It updates the account values and feeds Analysis and the retirement projections. A subtotal by account type and account ownership is nice but not a must have. I know which account is what and who owns it. I don’t need a monthly history either. I come to Full View only when the holdings of my manually linked account change, which rarely happens. I use Analysis more often to look at the asset allocation.
I don’t use the budget and spending features in Full View at all. I think Fidelity should abandon their pursuit in that direction. It’s not their strength, and it’s much more complicated than tracking asset values.
Sunny says
I totally agree with you and mentioned in my earlier comment on this post. I have been a Fidelity client for many years and feel they keep taking data and reports away and are dumbing everything down. I used to get substantive reports and materials and now all reports are gone from Full View. I have given my feedback on the site, to my FA and customer service and in the Reddit sub to no avail. I am not sure who is heading up their web and mobile team but they are not making it better. We have had issues with Quicken due to changes they made as well. I am not leaving them but I do pay for Boldin and use a few free sites to feel more confident about my DIY investment approach and success.