Note from the editor: This is a guest post from long-time reader KD. KD contributed Looking At the Big Financial Picture back in 2012. I also interviewed KD in Lifestyle Design: Choose Where You Live. Now six years later, KD shows us how to use a simple table to document and track a financial plan. If you also have something to share and you don’t want to create a blog of your own, please contact me.
***
When it comes to financial planning, websites rush to convince us of our magic number (usually something farfetched enough to make us groan), tell us about the asset allocation that will be our salvation, or offer faux empathy of office cubicle hate. Thankfully, sane voices like Harry’s avoid the gimmick and ask us to hold ourselves accountable with our actions instead.
I will be honest that we are far behind in our estate planning – but with the beneficiaries of our major assets updated, we feel a small bit prepared. What else makes us feel prepared? Our financial plan!
Recently, Vanguard came up with a roadmap to financial security. It focuses on determining goals, understanding risks, assessing resources and developing a plan.
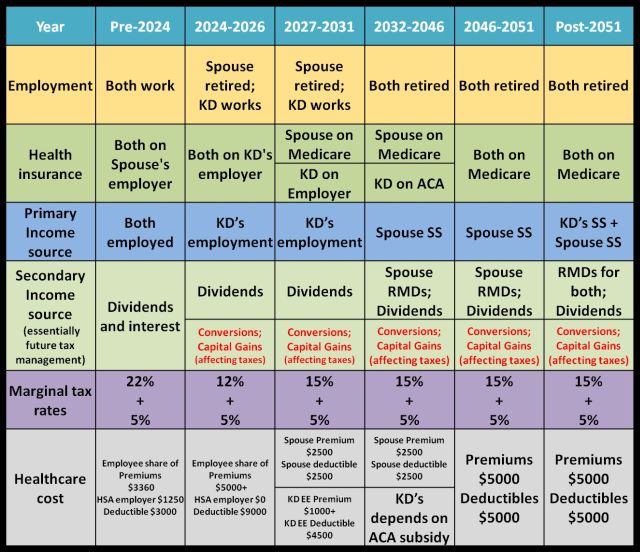
I believe we implicitly followed through these steps to develop our plan. It is a simple table with a range of years that details the stage in which we envision ourselves. An example of ours is shown below.

We focused on employment status, income source and provisioning for health insurance as major blocks to work with.
The employment status – whether to work or retire; and what year in future to retire was informed by the willingness and need to work, accumulation of assets (aka dollar amount of portfolio) and age.
The income source was informed by age, tax bracket and employment status. Age 70 is best choice to claim social security in our situation. The tax laws dictated planning for years between retirement and start of Social Security with maneuvers such as availing tax-free capital gains and qualified dividends or Roth conversions in years with one-income, and lower tax bracket. This in turn helped with a plan to hold Modified Adjusted Gross Income (MAGI) under certain thresholds to avail ACA subsidy in the future – if it is still there.
Healthcare costs were simplified and presented to include our share of premiums, deductible before cost sharing kicked in and HSA contribution from employer, if any. The rest of details of healthcare plan such as pharmacy benefits, coinsurance percentages, out of pocket maximum etc were deemed as not critical to help us evaluate the headline costs for the healthcare plan.
As you can see, once we had our blocks, we started playing with them to understand the interconnectedness between them.
The plan is simple, flexible, and without too many numbers or percentages. The table helps us think through our what-ifs.
For example, if my spouse retires earlier, then the duration of second column increases. This gives us more opportunity for Roth conversion and tax free capital gains; reducing RMDs in future and reducing capital gains for our taxable pot of money; and increasing ACA subsidy in future for me, if it is still there.
But this is also the duration that increases our healthcare cost exposure the most. How should we work it out?
Maybe we will have 18 months of COBRA when my spouse retires and that could be a better option for just my spouse, and I would go on my employer’s insurance plan. The net cost would be cheaper this way.
Having the duration of second column the least (by increasing the duration of first column) also increases our financial security the most. So where is the trade off point?
So the plan raises questions and does not provide all answers?
Yup! It brings you the awareness of your choices and their impact.
We check to see where we are with our plan each year. This is where the equally important second part of the title of this article comes in: update it.
We have found tools like Extended I-ORP, Fidelity Retirement Calculator and Personal finance toolbox spreadsheet helpful with this process. We use these tools for assessment on where we are and if we are on track. Given the implicit assumptions in these calculators, we do tend to take them with a healthy dose of skepticism.
Life will throw its share of curveballs at you. You have to go with the tide, reassess your situation and keeping moving ahead.
I lost my job earlier this year, found a new one, took an enormous pay cut, and sought more time off in new job. (Good old pivoting – aligning and prioritizing more of what I want – at a steep cost, of course!) We spent 20% of our annual budget on a series of unexpected expenses including an emergency room visit in a 4 week span. Thankfully, that HSA, that tax refund, that severance – all helped.
Planning ahead certainly has helped us to be prepared for the uncertainty of our future. We hope it continues to do so for us. And for you too!
Learn the Nuts and Bolts
I put everything I use to manage my money in a book. My Financial Toolbox guides you to a clear course of action.
KD says
Thank you Harry for the opportunity.
Laurel says
KD’s post and the linked Vanguard white paper are extraordinarily helpful. I’m putting together my own table right now based on KD’s, and it’s already clarifying my thinking for the next decade or so when I go through so many life/financial changes in different years.
The only column I’m adding is one for my own age, right under the Year column, since I associate landmarks like starting Medicare with turning 65, rather than the year 2021, and starting social security with turning 70, and not 2026.
Thank you!
KD says
Thank you Laurel!