
Social Security gives everyone an official “Full Retirement Age.” It’s 67 for those born in 1960 or later, but you can claim as early as age 62, as late as age 70, or anywhere in between. The tradeoff is between a lower monthly benefit for more years and a higher monthly benefit for fewer years. The uncertainty lies in how long you’ll live.
Whenever there are choices and uncertainty, people try to optimize. Everyone is looking for the holy grail — when to claim Social Security to maximize the benefits. But how much does it matter, anyway?
Open Social Security
If you’ve paid attention to this matter, you’d know Open Social Security. It’s the best tool for a Social Security claiming strategy, and it’s completely free.
The primary input in Open Social Security is your Primary Insurance Amount (PIA), which you obtain by creating an account with the Social Security Administration, copying your earnings history, and pasting it into ssa.tools. See more detailed steps in Retiring Early: Effect on Social Security Benefits. If you’re married, both of you should go through this process to get your separate PIAs.
Open Social Security uses your PIA, marital status, gender, and date of birth — and the same for your spouse if you’re married — to calculate a recommended strategy. For example, it produced this output for someone single, male, born on 4/15/1960, with a $3,000 PIA:
You file for your retirement benefit to begin 10/2025, at age 65 and 6 months.
The present value of this proposed solution would be $416,562.
Open Social Security tells you exactly when to claim Social Security, which is great, but don’t stop there. Otherwise, you’ll miss this calculator’s best feature.
Spectrum Chart

Scroll down to the bottom of the page (on a computer, not on your phone). You see a spectrum chart showing how much the present value of the benefits would change if you start your Social Security on other dates. As you move the mouse along the spectrum chart, the tooltip shows a percentage of the maximum for that start date.
Open Social Security recommends claiming immediately in this example, but the spectrum chart shows that this person would still get 99.3% of the maximum present value if they wait another year. And the worst case for this person? Claiming at age 70 gets 95.2% of the maximum present value.
The spectrum chart and the total present value answer this critical question:
How much does when to claim Social Security matter?
The total present value of Social Security benefits claimed at the most optimal time is $416,562 for this person in the example. This tells them how much Social Security plays a role in their retirement finances. If this person has a $1 million net worth, Social Security represents close to 30% of the total. Claiming at the worst time and getting 95% of the maximum present value decreases the total by 1.5%. I’m not suggesting that one should throw away 1.5% willy-nilly, but I would say it’s well within the margin of error.
Heat Map
It’s more complicated for a married couple. The one-dimensional spectrum chart for a single person turns into a 2D heat map for a married couple. I ran another case as an example, which produced this chart:
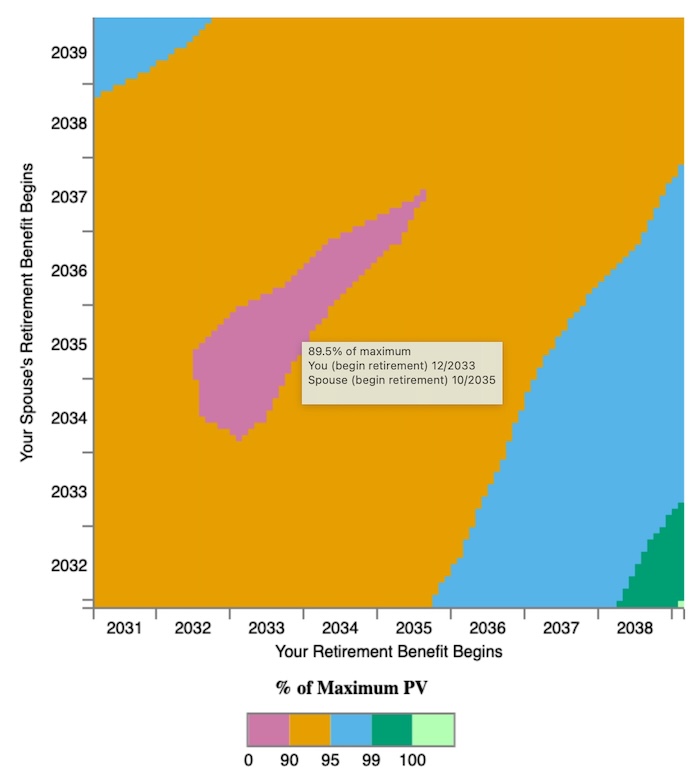
The horizontal axis represents one spouse, and the vertical axis represents the other spouse. The recommended strategy is at the bottom right. One person should delay until age 70, and the other person should claim as soon as possible, which is a common strategy for many married couples. The maximum net present value of their benefits is about $800,000.
The green and blue zones at the lower right of the heat map indicate that this couple has significant leeway in when to claim. As long as one person claims early, the other person can claim at any time within a 3-year range (going horizontally at the bottom), and they would still get more than 95% of the maximum present value. Or as long as one person delays until 70, the other person can claim at any time within a 5-year range (going vertically at the right edge), and they would still get more than 95% of the maximum present value.
The magenta patch in the middle represents the worst combinations of claiming dates. If they didn’t know any better and they picked the absolutely worst claiming dates, they would get 89.5% of the maximum present value.
How much claiming dates matter for this couple depends on how much they have outside Social Security. If they have a $1 million net worth, Social Security represents close to 45% of their total resources ($800k over $1.8 million total). Choosing the worst claiming dates would put a 4.5% dent in their retirement, which is more meaningful than the 1.5% in the previous example, but if they can keep it above 95% in the blue and green zones, I would say that the effect of claiming dates falls well within the margin of error.
Shifts in Strategy
Open Social Security uses a market interest rate to calculate the present value of the Social Security benefits. Interest rate changes can affect the recommended claiming strategy. Sometimes people are surprised to see a big shift in the recommendation when they run the calculator again at a later time. For example, it used to recommend claiming at age 70, and now it recommends claiming at 68.
I wouldn’t worry about it if the previous recommendation is still within the blue and green zones. The point of using Open Social Security isn’t to get a single “best” claiming strategy. Mike Piper, the creator of Open Social Security, said this in his blog post in 2020:
What matters most isn’t picking the very best strategy. What matters most is just avoiding a really bad one. There are usually plenty of strategies that are practically as good as the very best strategy.
Open Social Security uses mortality tables for the probability of your living to each age. As good as it is, it still only calculates based on probabilities. No calculator knows when you’ll die. The best strategy from any calculator won’t be the best if you defy the probabilities.
Make It Not Matter
Here’s how I would use Open Social Security with my Make Fewer Things Matter approach:
1. Read the maximum present value output from Open Social Security. Calculate its weight in the total retirement resources.
Social Security / (Social Security + Non-Social Security)
2. Take note of the green and blue zones in the heat map. All claiming dates in the green and blue zones give above 95% of the maximum present value. Look for the worst case as well.
3. Combine (1) and (2) to realize the large leeway in when to claim Social Security.
Claiming dates don’t matter much as long as you stay in the green and blue zones in the chart. Write down where your green and blue zones are. Save the chart image if you’d like.
Even the worst dates don’t matter much if (a) the weight of Social Security is sufficiently small in your total retirement resources; and (b) the worst dates still give you close to 90% of the maximum.
Of course, you don’t choose the worst dates on purpose, but it’s a relief to know how little it matters, and it’s not possible to screw up too badly. You pick a spot in the green and blue zones, cross it off your mind, and move on to more important matters.
Some people are concerned that claiming Social Security early may affect their ACA health insurance premiums. I address that concern in How Does Claiming Social Security Affect ACA Health Insurance?
Learn the Nuts and Bolts
I put everything I use to manage my money in a book. My Financial Toolbox guides you to a clear course of action.
abc says
I spent time with the available free calculators and my own spreadsheets trying to figure out the best time to take Social Security (SS). Playing with the calculator you quickly learn that forecasting your demise was the key – something most of us don’t know how to do. Finally, my approach was to ask myself what I wanted to have SS do for us. I am seven years older than my wife, my wife was the lower wage earner, and we have other resources
The answer as to what we wanted SS to do for us was to provide protection in two areas. The first was to cover the event that I die early. The second was to cover both of us living long lives.
Without a calculator, the obvious decision was for both of us to wait until 70 to take SS.
Each person should take time to evaluate when to take SS. However, start by asking yourself (and, if you have one, your spouse), what you want SS to do for you, when taking into consideration your personal life and resources. You may get the answer without a calculator.
Remember, the calculators don’t give you the right answer – they give you an answer based on your time of death guesses. The right answer will only be known after you die, so don’t chase your own tail too hard.
JT says
Determining the NPV using a real discount rate such as 20 or 30 year TIPS is critical to determine where the break-even points are for both SS and Roth conversions.
In my case, the SS B/E with a 0 rate like many online calculator use indicated B/E in early 80’s for any claiming age between 62 and 67 but a 2.x% discount rate pushes it out by a decade.
Marc says
Great perspectives. For me, another factor is maximizing low-bracket Roth conversions until age 70.
Tom H says
A while back I did an expected value analysis of the outcomes, using the IRS mortality table.
I was surprised at how little the benefit commencement date mattered, but on second thought, it shows that the benefit reductions for early claimants and the increased benefits for deferred commencement were actually well chosen. What matters more is whether you have a good paying job that is also satisfying. If so, you need to weigh the increased benefits and the tax consequences of claiming benefits while working. Also any health concerns. Not everything is a math problem.
Marc says
Thank you, Harry, for writing this article in your usual clear and straightforward manner. I’ve been using Open Social Security for several years and the results are always the same for my wife and I — the split strategy — my wife takes SS early and I take it at age 70. I always run the numbers that way and also if I wait until age 67, and the latter is always lower, of course, but not drastically so. Your article and the heat map confirms the results I’ve always gotten.
My approach is to wait until 67 and decide about waiting the extra three years then. I did t retire when first eligible to do so and I didn’t take SS when first eligible to do so. Both are personal choices. A lot can change in one’s life in a short amount of time. You can be healthy, seem healthy, and still that can change quickly.
The reason this has become such a difficult decision for many is because we are all missing the key variable — longevity. Given the choice between being pessimistic or optimistic about my lifespan, I choose to be realistic.
For this with more questions, the Social Security Administration has a good help website, including this FAQ:
https://www.ssa.gov/faqs/en/
Mar in So Cal says
Hi – great article. I was not able to generating any heap maps. Any idea how I can see the heat map?
Marc says
If you indicate you are a couple and enter your spouse’s information, it will display automatically but you have to scroll down the page.
Harry Sit says
After you submit your data and see the recommendation, scroll all the way down to the bottom of the page.
Harry Sit says
P.S. Do it on a computer, not on your phone.
Mar in So Cal says
Thank you for response. I did this on computer and there is no heat map at bottom. I do see the chart with year by year benefits for self and spouse.
Marc says
I tried it from my phone using the website in my browser to confirm my hunch regarding why you are not seeing the heat map. When holding my phone vertically (portrait view), the heat map doesn’t display. When holding my phone horizontally (landscape view), the heat maps appears. You must be seeing the mobile version of the website (portrait view). If using a phone, rotate it to landscape view. If using a tablet it a laptop or desktop computer, maximize the window so it is wider and you should see it.
Mar in So Cal says
thanks for your response, but still not working for me and I tried these different ways – on macbook air – in Chrome and Safari, on ipad both portrait and landscape, on iphone both portrait and landscape. Just not meant to be for me.
Harry Sit says
Maybe it has to do with your inputs. Do you see the spectrum chart just with the default input (single, male, 4/15/1960, $1,000, filed=no)? Go past “Pick Up a Copy of My Book” and look under the heading “Test an alternative claiming strategy.”
Harry Sit says
I see a spectrum chart with your inputs. Do you? When Spouse 2 already delayed claiming to age 70 in 2022, there’s no way to rescind it or any point to suspend the benefit. The only decision left is when Spouse 1 will claim, and Spouse 2 will claim the spousal benefit at the same time. Therefore the calculator only displays a one-dimensional spectrum chart, not a 2D heat map.
barrack says
soo, if one doesn’t claim at the start of the green area, is there some loss ? e.g claiming at the end of the green area? eg the time from the start of the green to the end of the green(when claimed at the end) ?
don’t really understand.
if the chart is going to possibly change , how many year apart should one be checking the graph? and if it is changing is it really so useful ?
Mar in So Cal says
Harry these were my initial inputs: spouse 1 – Female, Sept 1962, FRA PIA 3413, not collecting yet; spouse 2 – Male, Feb 1952, FRA PIA 1088, started collecting Feb 2022.
Harry Sit says
One spot (marked as light green) in the green area represents the maximum total present value. That’s the recommendation at the time you run the calculator. It may be at the start, the end, or in the middle of the green area. All other spots in the green area have a total present value within 1% of the maximum. Interest rate changes affect where the maximum lands. It doesn’t matter where the exact maximum is when you choose a spot close enough to it.
Run it once to make a plan. Pick a spot close enough to the recommendation. Run it again when you’re closer to your planned date. Continue with your plan if it’s still within the green and the blue zones.
Mar in So Cal says
Harry, thanks for explaining that there is no heat map in situations where one spouse has already started collecting at age 70.
B says
dumb question, but say the annual benefit is the same from age 62 “thru” age 69 , and someone then didn’t take SS starting at age 62 , is that somehow lost money, since waiting longer brings no further increase in “annual benefit” ? ; because of the ACA and MAGI, I’m not wanting to take SS till age 65 + ; or say one turns 65 in Dec of some year, would they begin SS January of the following year to avoid ACA repercussions?
Harry Sit says
I’m not sure why the annual benefit would be the same from age 62 through 69, but if that’s the case, then yes, the benefits from the years you don’t claim are lost, with nothing to compensate for them. Whether the total present value would be lower if you delay claiming is reflected in the results from the calculator. So just run the calculator to see if it’s lower if you delay, how much lower, and how that compares with the effect on ACA.
ACA MAGI goes by the calendar year. If you start Social Security in January, it doesn’t affect the MAGI for the previous year.
erik says
Hi Harry, to my surprise age 62 and 7 months was identified for me as a single individual. I don’t know if there is a way to know what the date of death was used to arrive at this answer (the underlying mortality table)? Using the alternative of waiting until 65 results in a zero percent change in the PV. Since I am on the ACA for health insurance, I am going to take SS at 65 when I am eligible for Medicare so I can better control my AGI on my tax form 1040 and achieve the largest premium tax credit..
Harry Sit says
The calculator uses probability-weighted present value from a mortality table. It projects the benefits from claiming at 62 and 1 month to each age, weighted by the probability of your living to that age, discounted by a market interest rate. It does it again for claiming at 62 and 2 months, and so on. After hundreds of such calculations, claiming at 62 and 7 months has the highest total present value for you, although claiming at 65 isn’t too far behind. The chart at the bottom shows your range of good options. When you have a good reason to claim at 65, and 65 is within the range of good options, go for it.
B says
so if one has a green spectrum range from age 62-68, one should start SS ideally at the start of the green range in order to not have lost the years of SS payments by waiting till the end of the green line?
assuming the NPV isn’t going to change during if re-doing the calculation each year closer to or after age 62?
and
2) that if the SS income (say $15,000/year) for the MAGI for the ACA , doesn’t end up resulting in > $15,000 increase in annual ACA premiums?
Harry Sit says
All spots in the green spectrum range have a present value within 1% of each other. Call them equal for this discussion. The present value already takes into account the lower benefits for more years and the higher benefits for fewer years. If you start later in the range, you get higher benefits to compensate for the lost years. It doesn’t matter when you start when you’re in the range (before considering other factors, such as ACA health insurance).
SS income counts in the MAGI for ACA, but if you were withdrawing from your IRA to cover expenses, you can stop the withdrawals when you have SS income now. Then your MAGI doesn’t increase. If you’d rather remove ACA health insurance as a factor, you can wait until you’re 65. You’re not losing anything when 65 is also in the green zone.
AlmostRetired says
Thank you for compiling the useful set of links – I’m retiring at 57 (next year) and it’s been annoying that the ssa.gov site doesn’t give a way to model the impact of working X more years instead of just putting in an amount for future annual earnings.
Two things strike me when I did the analysis taking social security before 65 can be a bad move if you don’t absolutely need the money and depending on how your other retirement income is structured.
1. ACA premium tax credits being asked on MAGI, it’s better to keep taxable income below the credit threshold if you can. Taking social security will make that harder to do if you have other income sources that fill up your limited MAGI ($84k this year I think). (I have a deferred compensation plan + a small annuity that fills up $50k of that window and want to harvest 0% LTCG tax with what I have left.)
2. Any Roth conversions from 65-69 (past the ACA window) are going to just give more of that social security back to the government.
I realize that a lot of people aren’t going to be concerned with those issues, but if we are talking people optimizing their retirement strategy I think those are big factors to consider especially since the article mentions people with higher net worth and what the percentage of that net worth the present value of the social security benefit will be.
Not a complaint about your article specifically – more that these factors seem to be left out of a lot of the discussion and modeling in software tools like Boldin and the ACA issue is particularly sticky if you retire prior to 65. (Based on current prices, my ACA could realistically be higher than $2000/month for my wife and myself and reducing the credits by taking social security early could end up COSTING money or just being a wash.)
Harry Sit says
I addressed the ACA issues in a follow-up post How Does Claiming Social Security Affect ACA Health Insurance? You may still want to delay claiming because of your deferred compensation plan and annuity, but claiming before 65 may not affect others as much as it affects you.
Jim says
I am wondering how the conclusions might change if all the SS income is invested instead of being used for the years between the initial claiming date and age 70 for the higher paid spouse? For example, claim at age 68, thus forfeiting the higher SS payout at age 70, but invest the SS payments from age 68 to 70.
Harry Sit says
Investing the benefits is already taken into account by the present value calculation. $1,000 received at age 68 is given a higher present value than $1,000 received at age 70. Mike Piper, the creator of Open Social Security, wrote in more detail about this aspect in his blog post:
Claiming Social Security Early to Invest It: What Rate of Return (Discount Rate) Should We Assume?