I showed how to estimate the effect of Roth conversion and capital gains when you buy health insurance from the ACA marketplace in the previous post Roth Conversion and Capital Gains On ACA Health Insurance. Some readers wanted to see how it works for retirees on Social Security and Medicare.
Roth Conversion for Retirees
When you do a Roth conversion, you transfer money from your pre-tax account to your Roth account. You pay taxes on the transferred amount now, in the hope of avoiding paying taxes at a higher rate in the future. It’s a form of prepayment.
As in other prepayment situations, sometimes it makes sense to prepay, and sometimes it doesn’t. You convert to Roth and prepay taxes now when you think your future tax rates will be higher than your current tax rates. When you prepay taxes with money currently in a taxable account, that money effectively moves into a Roth account, removing taxes on the future earnings.
You need to know the tax rate you pay on your Roth conversion to judge whether it makes sense to convert. The tax rate you pay on your Roth conversion depends on how much you convert. Conversely, if you set a limit on the tax rate you’re willing to pay on a Roth conversion, you need to know how much you can convert before you hit that maximum tax rate.
Case Study Spreadsheet
My favorite tool for this type of planning calculation is the Case Study Spreadsheet created by user MDM on the Mr. Money Mustache forum. It’s a spreadsheet file, not an online one. You’ll need Microsoft Excel to use its full features. As with anything downloaded from the internet, you’ll have to trust the source. I exchanged some emails with the author, MDM. I trust this spreadsheet.
The spreadsheet does a lot of things. It looks overwhelming when you’re only looking for one feature out of many. I’ll show you how this spreadsheet calculates the effect of Roth conversion when you’re on Social Security and Medicare. I’m using version 26.04 released on July 16, 2025, which has been updated with changes from the 2025 Trump tax law.
Download the Spreadsheet
The link to the latest version of the spreadsheet is in the first post in the Case Study Spreadsheet updates thread in the Mr. Money Mustache forum. Click on the link and choose File -> Download -> Microsoft Excel (.xls) to save the file to your computer. Make a copy of the spreadsheet and only work with the copy. This way, you can always start fresh from another copy of the original spreadsheet to model different inputs.
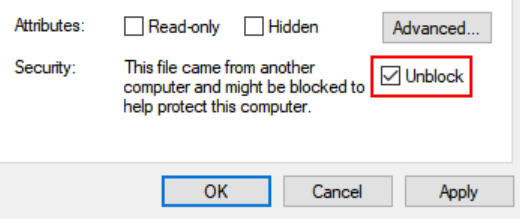
If you’re on a Windows computer, right-click on the copy in the file folder and click on Properties. Check the Unblock box to enable macros in the spreadsheet.
Open the copy in Excel. Click on Enable Editing and/or Enable Content if you see it in a yellow ribbon in Excel.
Set the Year
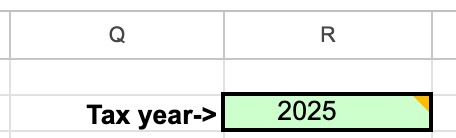
The spreadsheet includes tax data for several years. The version I’m using here can calculate for 2023 through 2026. You should first set the year.
Click on the Calculations tab at the bottom of the spreadsheet. Set the year in cell R2. After you’re done with one year, you can make another copy of the spreadsheet and change the year in the copy to examine the following year.
Scenario Example
I’ll use this scenario of a married couple as an example.
They’d like to know how converting different amounts from their Traditional IRA to Roth affects their taxes.
Age and Filing Status
You enter your filing status, number of dependents, and ages in green-shaded cells starting at cell G2.
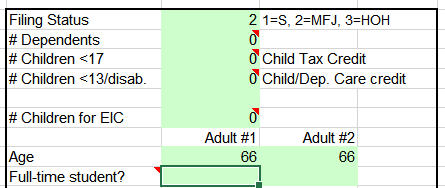
You go down to cell H38 to enter your state of residency.

Baseline Income and Medicare
Next, you enter your income. Since both spouses in our example are retired, we skip the paycheck items and scroll down to the non-paycheck income, starting in cell D25 — only input into cells shaded in green. Use annual numbers here.
Because withdrawals from Traditional IRAs are fully taxable in the same way as a pension, we enter the baseline Traditional IRA withdrawals in the line for pension income. This way, we reserve the line for Traditional IRA withdrawals strictly for Roth conversions.
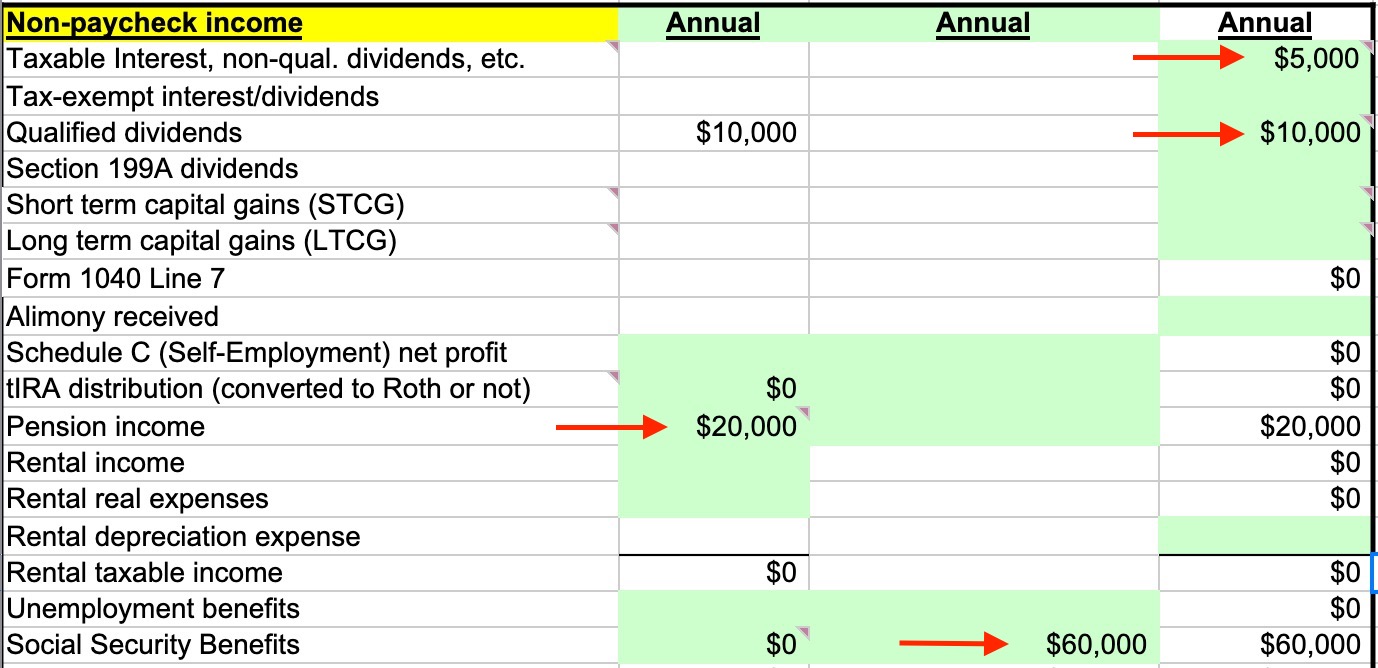
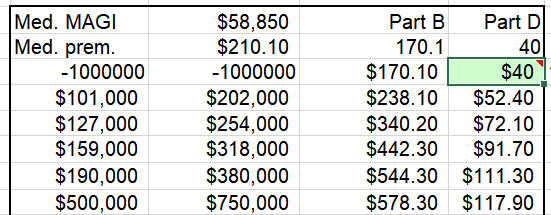
We enter their Medicare Part D premium in cell AF81. This is the monthly premium for one person. If you and your spouse are on different Part D plans, use the average premium of the two plans. Here, we assume their monthly Part D premium is $40 per person.
Tax Calculation
Now we go to the tax calculation area, starting in cell F11. This shows their baseline income taxes.
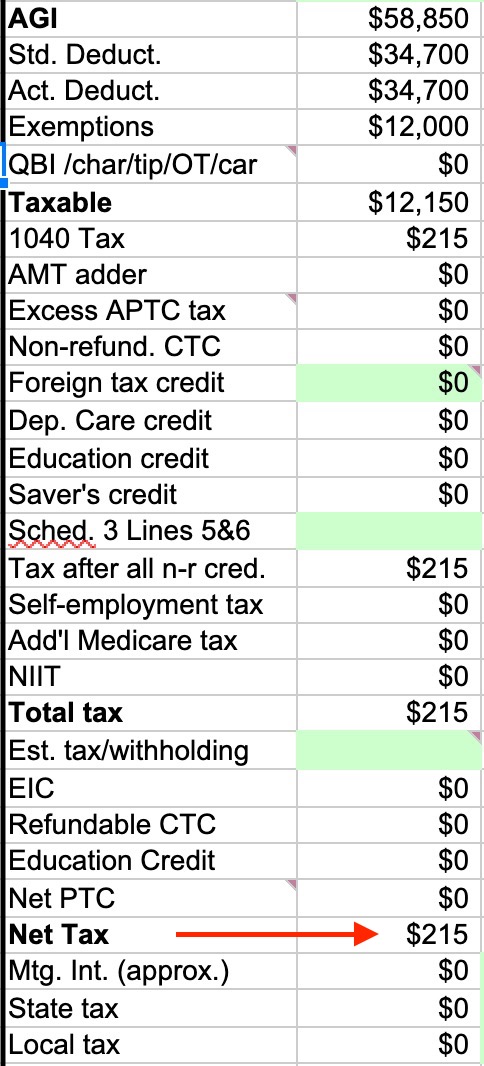
This retired couple with a gross income of $95,000 pays $215 in taxes. That’s only 0.23% of their gross income.
Explore Roth Conversion
They’re interested in doing a Roth conversion to take advantage of the low tax rates. Scroll down to cell F85 to see a chart like this:
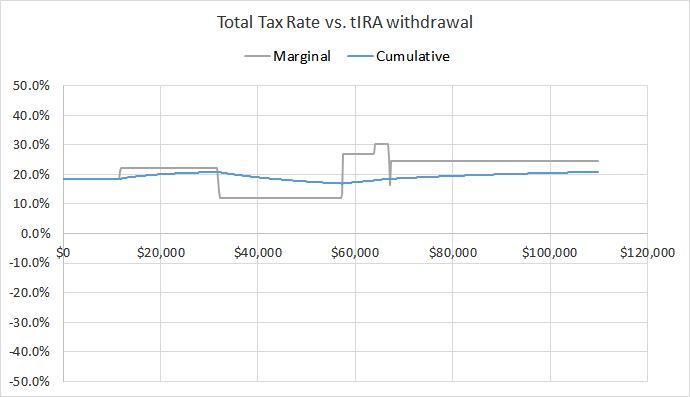
It shows the marginal and cumulative tax rates at different amounts of Traditional IRA withdrawals. Because we entered their baseline Traditional IRA withdrawals as pension income, all the withdrawals in this chart represent Roth conversions. The numbers on the Y-axis include federal and state taxes plus Medicare IRMAA.
We’ll make a few adjustments to see the chart better.
Adjust the Chart Scale
By default, the Y-axis in the chart goes from -50% to +50%. The bottom half of the chart is empty for our example. Select the Y-axis in the chart, right-click, and click on Format Axis… Set the minimum to 0 and the maximum to 0.35. It will use the full space for the chart. Now the chart looks like this:
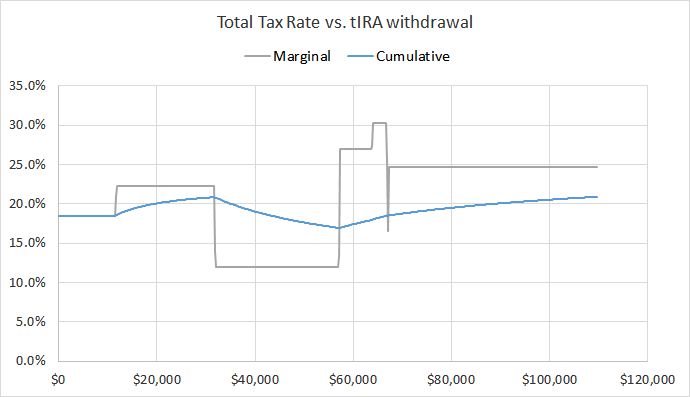
The blue line shows that converting $10,000 will incur a cumulative tax rate of 19%. Converting $30,000 costs 21%. The cumulative tax rate drops to 17% when they convert $57,000, before it rises to 21% when they convert $110,000.
The first surge from 19% to 21% is the so-called tax torpedo, which happens when additional income makes more of the Social Security benefits taxable (see previous post Calculator: How Much of My Social Security Benefits Is Taxable?). The cumulative tax rate drops after 85% of their Social Security benefits are already taxable. As they increase their Roth conversion to $57,000, the effect of the “tax torpedo” gets spread out. The “tax torpedo” is more like a small ding than a torpedo for this couple.
Extend the Range
Increasing the number in cell P86 will extend the X-axis in the chart to larger numbers. For example, changing cell P86 to $700 makes the chart look like this:
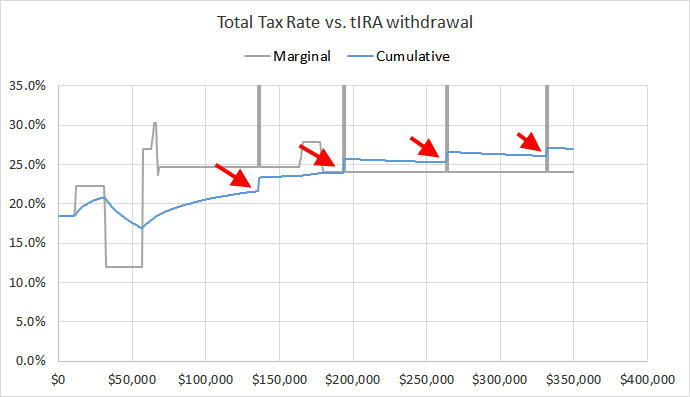
The four spikes in the marginal tax rate (the gray line) represent Medicare IRMAA. Point your mouse at points before the blue line bumps up. You’ll see the Roth conversion amount and the cumulative tax rate associated with each bump.
Identify Break Points
The chart shows they’ll pay 22% in taxes if they convert $135k before their income hits the first threshold for IRMAA. The cumulative tax rate will be 24% if they convert $193,000 and stop before the second IRMAA tier, 25% if they convert $263,000 and stop before the third IRMAA tier, and so on.
| Break Point | Roth Conversion Amount | Cumulative Tax Rate |
|---|---|---|
| Before “tax torpedo” | $10,000 | 19% |
| Top of the 12% tax bracket | $57,000 | 17% |
| Before the first IRMAA tier | $135,000 | 22% |
| Before the second IRMAA tier | $193,000 | 24% |
| Before the third IRMAA tier | $263,000 | 25% |
This couple can decide how much to convert based on the size of their pre-tax accounts and their guess of future tax rates. Convert more if they have large pre-tax accounts and they think tax rates will be high in the future. Convert less if they don’t have large pre-tax accounts and they think tax rates will be low in the future.
The shape and the breakpoints for your specific scenario will be different. You can follow this example and use the chart to map your own breakpoints and tax rates.
Save the Spreadsheet
You may see a warning like this when you save the spreadsheet:
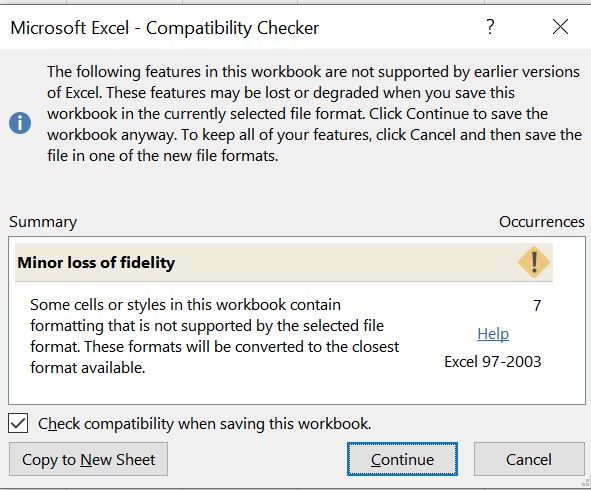
This is normal. Click on Continue to save the spreadsheet.
Limitations
The Case Study Spreadsheet is an excellent tool to explore how converting different amounts to Roth affects your taxes, but the part of the spreadsheet used in this post shows only one year. It doesn’t show the effect of converting over multiple years.
For example, you see that you will pay X% in taxes if you convert this much now, but you don’t know whether converting more (or less) would be better in the long run when you take into account the size of your pre-tax accounts, your age, your spending needs, investment returns, your Required Minimum Distributions (RMD), etc., etc. You’ll have to decide yourself whether paying X% in taxes on a Roth conversion is “worth it.”
Other software tools, such as Retiree Portfolio Model (RPM), MaxiFi, Boldin, ProjectionLab, and Pralana, examine multiple years based on a set of inputs and assumptions to suggest how much you should convert each year. The big question is whether those inputs and assumptions will hold true.
Mike Piper, CPA, made a good argument against projecting too many years into the future in his blog post Long-Term Tax Planning Requires Guessing. Focus on the Near-Term. The future can’t be predicted reliably. Your spending needs will change. Investment returns may be strong or weak. Tax laws change. You won’t know what your tax rates will be in the future.
I see a good reason to review only one year at a time with the Case Study Spreadsheet. The decision won’t necessarily be “optimal” in the long term, but trying to “optimize” several decades out may be only chasing rainbows. I strive to banish the word “optimize” from my financial life, and from life in general.
***
The purpose of a Roth conversion is to take advantage of low tax rates. If your retirement is dicey, the best Roth conversion strategy won’t cure it. If your retirement is secure, a reasonable attempt at Roth conversion is only trying to make an already good situation better. So don’t get stressed out when you don’t know how much you should convert. You can use the Case Study Spreadsheet to find a reasonable answer one year at a time.
Learn the Nuts and Bolts
I put everything I use to manage my money in a book. My Financial Toolbox guides you to a clear course of action.
Kira says
Thanks so much, Harry! I love all your articles, and this is exactly what I need to help my mom decide how much is reasonable to convert each year.
Michael says
Harry, I’ve been trying to make your step-by-step procedure work (using your imaginary couple’s data) on the Mr. Money spreadsheet but the graph does not display as you show it. I’m using the 22.16 version (Dec. ’23) of the spreadsheet and have unblocked and enabled macros. Have you tried it lately? It would be great to find a fix.
Suresh Bhat says
This is a great article.
one think I did not understand is:
fot 2025 why 0% inflation figures and 3% inflation figures are same. 3% figures should be higher than 0% figures.
e.g. Magi for 2025 for joint return is 212K for both 0% and 3%.
Harry Sit says
You must be referring to Medicare Part B IRMAA Premium MAGI Brackets. The published brackets use rounding. It is higher with 3% than 0% but not enough to matter after rounding.
Suresh says
sorry for creating confusion.
Due to Roth conversion in 2023 my magi is $212320. more by only $320.
I am therefore interested in actual number when it is published for irmaa 2025.
thanks for clarification
Harry Sit says
Sorry, it looks like your 2023 income will cross the cutoff for IRMAA in 2025. Please check the IRMAA post before you convert to Roth this year and don’t let it happen again for 2026.
Suresh says
Thank you for your advice.
When will we know the exact limit for 2026.( 2024 Magi)
Some companies give their dividend on almost final day of December. That is why it is hard to guess Roth conversion amount.
May be I should not exceed Magi for 2024 :$210,000 though your fig. shows $214,000.
Harry Sit says
We’ll know the exact limit for 2026 in September 2025, which is too late to decide how much to convert in 2024. The best you can do is to check the IRMAA post in December 2024 and leave some room for surprises.
Suresh says
Great advice!
Suresh says
Sir ,
I have following question:
My wife and I both retired. Our income is from
1. Social security
2. Pension
3. RMD
4. Dividends and capital gain
we pay taxes on first two items monthly when they are paid to us. We pay taxes on RMD when we withdraw RMD ( mostly in First quarter)
We pay taxes on dividends end of every quarter.
Why IRS is charging interest and penalty every year saying that we need to pay them same amount every quarter.
Most of the dividend we get is in 4th quarter. Therefore we pay every quarter proportionate amount. ( more end of 4th quarter and less in other quarters) In other words our income is not same for every quarter. We therefore pay different amount every quarter.
Please explain how we can avoid IRS penalty and interest charges?
Harry Sit says
Suresh – Your questions aren’t related to this post. Please read Paying Estimated Taxes: Amount, Timing, and Mechanics and ask any questions there.
John Gates says
Conventional wisdom is a Roth may make more sense than a traditional IRA if one thinks they will have higher tax rates in retirement. Such higher rates are possible if one has built sizable wealth, gets a lot in social security income and has large IRA’s where eventually the RMD’s can be big. Other reasons to ponder the possibility of high future taxes would be the government needing money, something that could be exacerbated if Roths become too popular and deprive the government of tax revenues on IRA withdrawals. However, I just thought of something else. To get the money to put into a Roth, I have to pay my taxes (up to 22%). But I also have to pay almost 8% in Social Security and Medicare taxes. So if those last two arfe not taxes I pay in retirement, then to be paying higher taxes in rertirement (the main reason for Roths), not only do I need to be at above 22%, but I actually need to be above 22% + the approximate 8% Social Security and Medicare, i.e., above around 30%. All of a sudden Roths don’t seem as attractive. Am I missing something?
Separate but related is if I am paying 7% state tax now on the money I need to contribute to a Roth and in retirement live in a state with no state income tax, again, the prospect of being in a higher tax situation such that the Roth after tax contributions of 30 years prior were wise, becomes dimmer.
Harry Sit says
The almost 8% in Social Security and Medicare taxes are on employment income. You pay them anyway whether you put the money in a Traditional or Roth account. They’re not the same as the state income tax, which you will pay when you put the money in a Roth account but you can avoid in most states when you put the money in a Traditional account.
John Gates says
Yes, definitely pay them on employment income. But I can avoid some of them by going with a traditional 401K instead of a Roth. To fund a $7,000 Roth contribution if I am at about the 30% bracket (including social security taxes and medicare taxes), in the roundest of numbers I might have to earn $10,000 pretax, paying $3,000 in taxes. If instead I put the $7,000 in a 401K, it would reduce my income by $7,000 and I would defer taxes on the $7,000. If at age 60 I had enough nonretirement assets including profits from selling a big home as part of downsizing, I could live frugally off the nonretirement assets and do Roth conversions, managing them and other income (dividends, etc) such that I would be at the 12% bracket with zero social security taxes. Additionally, unencumbered by a job, I could live is a state with no income tax. At age 70 I could stop or cut back the Roth conversions and take Social Security. Yes, I know….the best laid plans of mice and men. But theoretically, it would be a cheaper way to effect a nice pile of money in Roths. I think.
Harry Sit says
I agree that a pre-tax 401k is better for most people than a Roth contribution (see The Case Against Roth 401(k): Still True After All These Years). It has nothing to do payroll taxes though. If you put $10,000 in a pre-tax 401k, you defer the federal and state income taxes but not the Social Security and Medicare taxes. You still pay the payroll taxes on that $10,000.
Doug says
I tried it on the 2025 version by inputting the wage info. For some reason, the 1040 total income (D42) did not subtract the 401K contribution, thus the tax amount is much higher and Roth conversion amount has been reduced a lot to hit that local minimum. By he way, is cumulative tax same as effective tax? Thanks.
Chad says
Hi Harry,
I mentioned Mr Money Mustache Case Study Spreadsheet which I downloaded, but I am not sure which year of each version for. Such as the file CashFlow 2022-2023-2024-2025 is for which year(s)? The title seems indicate for all 4 years, but it include Tax calculation and Std deduction and it has to be year specific (2025?). While a updated CashFlow 2023-2024-2025-2026 just released and I am confused which one is actually for 2025? If each of these versions is specific for perticular year, what are the other 3 years’ numbers for. I am new to these CSSs and there is no instruction or note explains it. Thanks.
Chad
Chad says
correction: You mentioned Mr Money Mustache Case Study Spreadsheet
Harry Sit says
The latest spreadsheet handles 2023-2026. You select the year in cell R2 on the Calculations tab. This is mentioned in cell B9 on the Instructions tab. The year is already defaulted to 2025.
Maria says
IRA Conversion
If traditional ira is converted to roth ira after required minimim distribution.. federal taxes taken out for 2025. 1040 SR tax form is done in February 2026 and realize we did not take enough taxes out. Can we request federal taxes be taken out in February 2026 for the tax year 2025? request for additional taxes be taken out for required minimum distribution and for additional IRA conversion. Thank you.
Harry Sit says
Many people realize they didn’t have enough tax withholding or they didn’t pay enough in estimated taxes when they do their tax return. Their tax return will show they owe a balance. You will give a bank account for the IRS to debit the balance, as opposed to depositing a refund. There may or may not be a penalty for underpayment, depending on how much of a balance is owed and how much the taxes were in the previous year. That’s just the normal tax filing process. It doesn’t matter whether a balance is owed because of RMD, Roth conversion, or any other reasons.
If you don’t want to owe when you file in 2026, request a higher withholding in 2025 or pay estimated taxes before January 15, 2026. See Paying Estimated Taxes: Amount, Timing, and Mechanics.
Laura says
I have entered info to see about implications of roth conversion. Great spreadsheet, and I really appreciate you taking the time to simplify filling out for us.
The one issue I do have is that it is showing that we owe state taxes (IA) on the conversion amount but Iowa no longer taxes any retirement income for those of us over age 55.
Doug says
Thank YOU so much Harry! I enjoy your posts. Can we continue to use this spreadsheet in 2027 and beyond to calculate Roth conversion? Many thanks!
Harry Sit says
The spreadsheet’s author updates it several times a year. If this pattern continues, it will be updated with 2027 tax brackets when the IRS announces them in the fall. You can set a calendar reminder to check for updates on October 15 each year.
S.B. says
I am waiting a week to get approval to use the program for Roth conversion. can some one Email me how to get the approval faster to use this program thanks in advance.
S .B
Harry Sit says
From the “Download the Spreadsheet” section:
“Click on the link and choose File -> Download -> Microsoft Excel (.xls) to save the file to your computer.”
You don’t need approval from anyone to use the spreadsheet.
George says
I just wanted to leave a comment in the hope that it clears up some confusion for others, that I had initially. The spikes that are noted as Medicare IRMAA are increases in Medicare premiums that occur *two year later*. So you don’t see them in your actual taxes for the current year. I modeled a 64 year old, who doesn’t even currently pay Medicare premiums. But the higher premium based on increased Roth Conversions will eventually show up, and is accounted for in the marginal and cumulative tax rate graph.
Also note that both the marginal and cumulative tax rates are referenced to the Roth-converted dollars, not the taxpayers total income.