Most online tax calculators don’t include the effect on the premium tax credit when you buy health insurance from a marketplace under the Affordable Care Act (ACA), also known as Obamacare. This is a major gap for millions of people, because their income affects the amount of subsidy they will receive. Getting a larger subsidy reduces their tax dollar for dollar; qualifying for less subsidy increases their tax dollar for dollar.
Case Study Spreadsheet
My favorite tool for tax planning is the Case Study Spreadsheet, which is created and updated by the user MDM on the Mr. Money Mustache forum.
It’s an actual spreadsheet file, not an online calculator. You will need Microsoft Excel to use its full features. As with anything downloaded from the Internet, you’ll have to trust the source. The author MDM puts a lot of work into this spreadsheet. I was invited to test it. As far as I can tell, it’s reasonably accurate.
This spreadsheet does a lot of things. It looks overwhelming if you’re only looking for one feature out of many. I’ll show you how this spreadsheet can help calculate the effect of Roth conversion or realizing long-term capital gains when you receive a subsidy for your ACA health insurance.
I’m using version 26.04 released on July 16, 2025, which includes changes made in the 2025 Trump tax law
Scenario Example
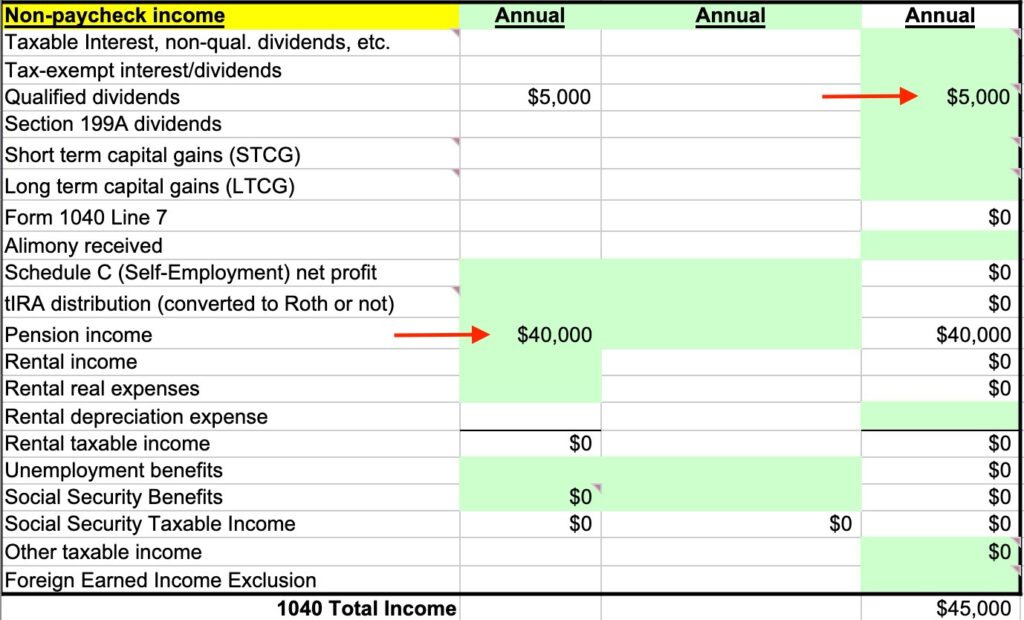
A retired couple, both age 60, Florida residents, married filing jointly, with no dependents. They live on $40,000 withdrawals from their Traditional IRAs and $5,000 in qualified dividends. They have no other income or deductions. The full price of the Second Lowest Cost Silver Plan from the ACA marketplace is $2,000/month. They chose that plan, paying $250/month out of pocket. The government pays $1,750/month directly to the insurance company as an advance subsidy.
Their questions:
- How does it affect their taxes and premium subsidy if they convert additional money from their traditional IRAs to Roth IRAs?
- What if they realize some long-term capital gains?
Download the Spreadsheet
The link to the latest version of the spreadsheet is in the first post in the Case Study Spreadsheet updates thread in the Mr. Money Mustache forum. Click on the link and choose File -> Download -> Microsoft Excel (.xls) to save the file to your computer. Because you’ll make changes in many places in the spreadsheet, it’s better to keep an unedited copy when you need to start over completely to model different inputs.

If you’re on a Windows computer, right-click on the copy in the file folder and click on Properties. Check the Unblock box to enable macros in the spreadsheet.
Open the file in Microsoft Excel. Click on Enable Editing and/or Enable Content if you see it in a yellow ribbon in Excel.
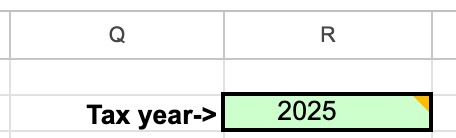
Set the Year
The spreadsheet includes tax data for several years. The version I’m using here can calculate for 2023 through 2026. You should first set the year.
Click on the Calculations tab at the bottom of the spreadsheet. Set the year in cell R2. After you’re done with one year, you can make another copy of the spreadsheet and change the year in the copy to model the following year.
Age and Filing Status
Enter your filing status, your number of dependents, and your ages starting at cell G2.
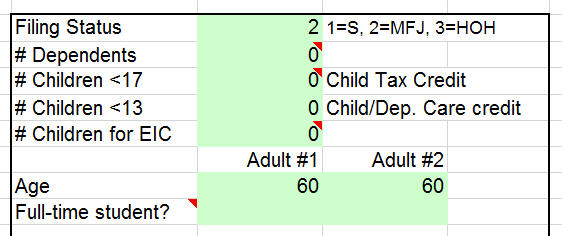
Go down to cell H38 to enter your state of residency.

Income
Since both spouses in our example are retired, we skip the paycheck items and scroll down to the non-paycheck income, starting at cell D25 — only input into cells highlighted in green. Use annual numbers here.
Because withdrawals from Traditional IRAs are fully taxable in the same way as a pension, we enter the baseline Traditional IRA withdrawals as pension income. This way, we reserve the line for Traditional IRA withdrawals strictly for Roth conversions. Similarly, if you have long-term capital gains in your baseline, add them to the line for qualified dividends to reserve the line for long-term capital gains for additional gains you may consider.
ACA Health Insurance
Go down to cells B117 and B118 to enter the full price of the health insurance premium and the advance subsidy paid by the ACA marketplace directly to the insurance company. Use monthly numbers here. Enter the advance subsidy amount as a negative number.

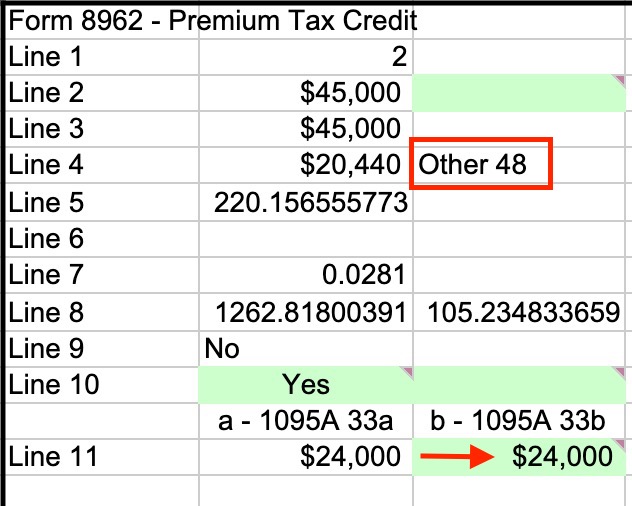
Now scroll to the far right to cell AC91 or use the find function in Excel to locate “Form 8962.” Enter the full price of the Second Lowest Cost Silver Plan in cell AE103 under the heading “b – 1095A 33b.” Use the annual number here. You may notice it shows “Other 48” in 8 rows above. If you live in Alaska or Hawaii, make sure to enter “AK” or “HI” in cell H38.
Tax Calculation
Go to cell F11 to look at the tax calculation. This shows the baseline income tax before any Roth conversions or realizing capital gains.
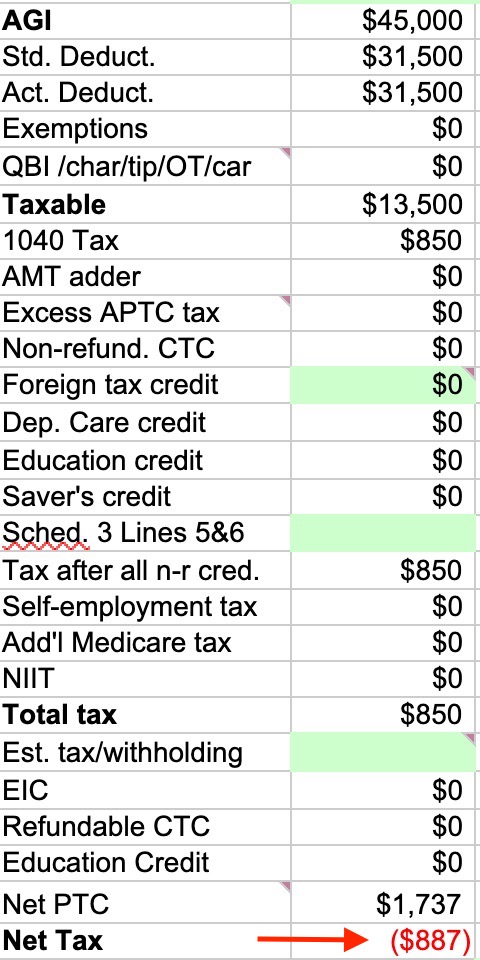
This retired couple will pay $850 in federal income tax and receive an additional $1,737 in ACA premium tax credit on top of the advance credit already paid by the government directly to the insurance company. They’re interested in converting from their Traditional IRAs to Roth IRAs to take advantage of the low tax rate before they start Social Security and RMDs.
Explore Roth Conversion
You see a chart near cell F85.
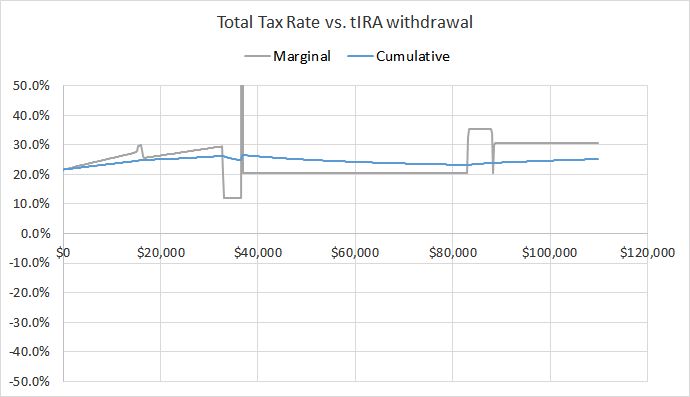
The X-axis represents different amounts in Traditional IRA withdrawals. 100% of the withdrawals here are from Roth conversions because we modeled the baseline IRA withdrawals as pension income. The Y-axis shows the marginal and cumulative tax rate on the Roth conversions, including the effect on the ACA premium subsidy.
Adjust the Chart Scale
The Y-axis in the chart goes from -50% to +50% by default. The bottom half of the chart is empty for our example. Let’s adjust the chart scale to make it easier to see. Select the Y-axis in the chart, right-click, and click on Format Axis… Set the minimum to 0 and the maximum to 0.35. It’ll use the full space for the chart. Now the chart looks like this:
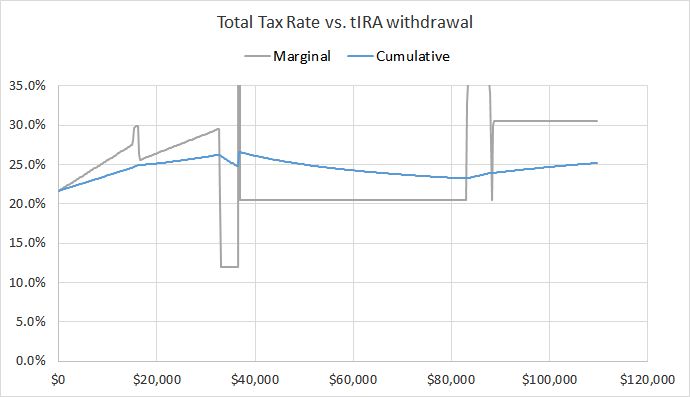
The blue line shows that converting $16,000 to a Roth IRA will incur a cumulative tax rate of 25%. Converting $37,000 costs 26%, and converting $83,000 costs 23%.
Extend the Range
Increasing the number in cell P86 extends the X-axis in the chart to larger numbers. For example, changing cell P86 to $700 makes the chart look like this:
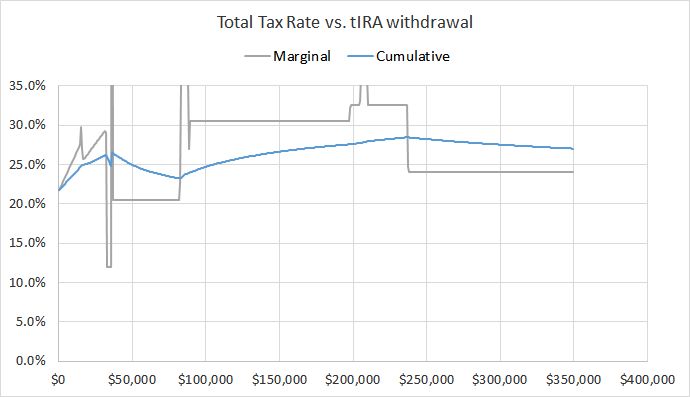
Point the mouse at various points in the blue line. You’ll see the Roth conversion amount and the cumulative tax rate. It shows that if this couple is willing to pay 27% for their Roth conversion, they can convert as much as $350,000.
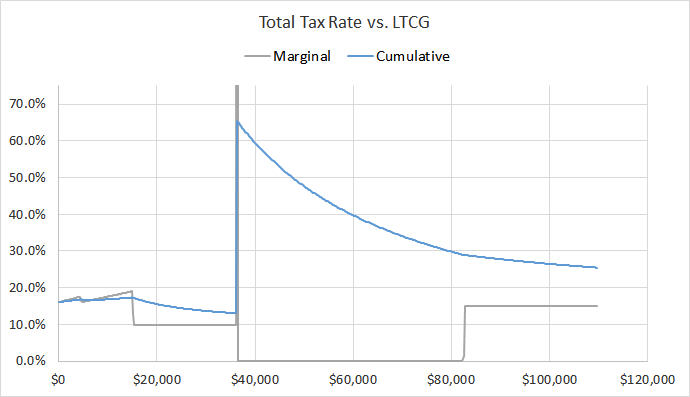
Long-Term Capital Gains
What if, instead of Roth conversions, they realize some long-term capital gains? We can change the X-axis in the chart from Traditional IRA withdrawals (Roth conversions) to long-term capital gains.
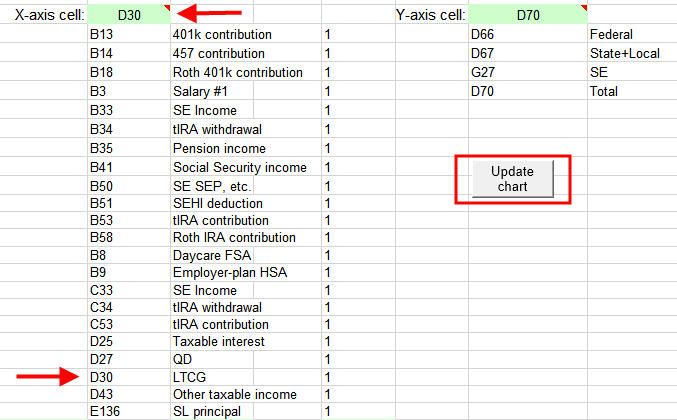
Choose D30 in the dropdown for cell G110. Then click on the “Update chart” button.
The shape of the chart is similar to the one for Roth conversions, but the rates on the Y-axis are different. It shows that they’ll pay 15% to realize $37,000 in long-term capital gains. The rate goes down to 12% if they realize $83,000 in long-term capital gains. These rates reflect the reduction in the ACA premium subsidy as they realize more capital gains.
Premium Subsidy Cliff in 2026
The ACA premium subsidy cliff is scheduled to return in 2026. The charts look quite different when we change the year in cell R22 to 2026 and follow the same steps above.
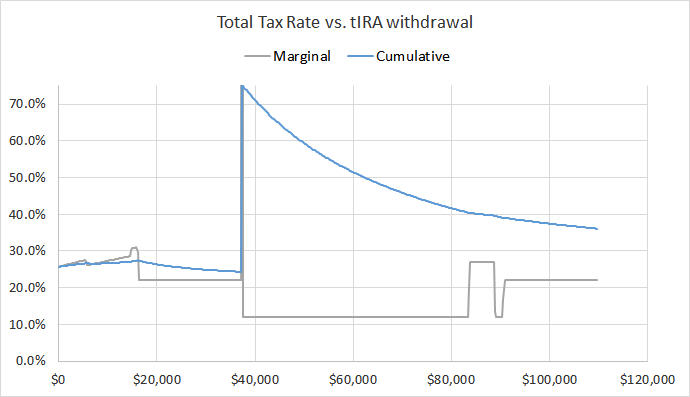
The cumulative tax rate for Roth conversions hits a wall at converting $37,000 in our example. The same goes for realizing capital gains:
The wall shows the effect of losing the premium subsidy when the income exceeds 400% of the Federal Poverty Level.
***
The Case Study Spreadsheet does a great job in displaying the effect of converting to Roth or realizing long-term capital gains while receiving the ACA health insurance subsidy.
The spreadsheet has a learning curve when you go all over the place to find the right spot for your inputs and look at the results, but it works wonders once you know where to enter things and what to look for. I thank the author MDM for the hard work. The more I use it, the more I’m amazed at how neat the spreadsheet is. It’s my go-to tax planning tool.
Once again, the link to the latest spreadsheet is in the first post by MDM in this thread on the Mr. Money Mustache forum:
https://forum.mrmoneymustache.com/forum-information-faqs/case-study-spreadsheet-updates/
The same spreadsheet can be used to show the effect of Roth conversions without the complications of ACA health insurance. I have another walkthrough with Social Security and Medicare in Roth Conversion with Social Security and Medicare IRMAA.
Say No To Management Fees
If you are paying an advisor a percentage of your assets, you are paying 5-10x too much. Learn how to find an independent advisor, pay for advice, and only the advice.
Brian says
This looks interesting. I plan to download the spreadsheet and try it out.
What I’ve done so far is to use our 2017 tax program, saving last year’s tax filing to a file named “Estimated 2018 Taxes,” manually over-ridden the personal exemptions with $0 and manually over-ridden the standard deduction with $24,000 (since our itemized deductions are less than that).
Then, entering our known & projected 2018 income, we establish a baseline income/tax estimate and then tweak the numbers for various “what if” scenarios.
Through tax-efficiently withdrawing from our assets, we keep our MAGI low enough to qualify for subsidized Marketplace insurance, we’ve had to (carefully) keep up with these “what if” scenarios the past five years.
Looking forward to trying out that spreadsheet!
Harry Sit says
Come next year it will be easier to use the tax software after they update the software for the new law.
Kevin says
Thank you Harry for this article. I hope it will help many to be able to better project their tax implications early in their tax year so they don’t fall into the trap I did the first year the ACA went into effect.
I had two operations and my wife had one that year so my medical expenses hit the Max out of Pocket for that year $10,500. So I wanted to pay all my medical bills and so withdrew money from my IRA to do so. I withdrew enough to pay those costs, my health insurance costs and a little more.
One GRAVE mistake I made was assuming that since those moneys went towards medical expenses they were not taxable just as they did not incur the 10% early withdrawal tax from early distrubution from my IRA….WRONG! It was included in my MAGI and the extra I took out put me over the 400% of Federal Poverty Level Limitation for qualifying for the ACA credit and I had to pay back the $10,000 credit I had received. Had I known that taking that money out would have disqualified me for the credit and also known that by taking just a little less … OR… DEFERRED PAYING PART OF MY MEDICAL BILL until January of 2015 and thus shifting taking some of the money to a new tax year my extra tax bill would have gone up only $2500 instead of $10,000.
Unfortunately there were no tax programs that were prepared for the new ACA available until late that year. I used Turbo Tax in April of 2015 for my 2014 taxes and their software even missed that the IRA distributions should not have incurred the extra 10% penalty because my medical expenses were high enough. My 2015 tax preparer caught that in the first couple of minutes looking at my 2014 return and filed an amended return and got that money back for me. That was only the second time in more than 40 years I didn’t do my own taxes. The other involved a real estate sale and monthly contract.
In your first two scenarios above if they had taken or converted $25,000 they would have exceed the 400% by just $40 and been subject to repaying the ACA credit and their tax bill would have gone up to $23,729… an almost 50% tax!
One note the FPL changes every year and is published around November of the year before it changes and is based the year before the tax year it is published for. Harry does a good job of explaining that here: https://thefinancebuff.com/federal-poverty-levels-for-obamacare.html. That link did pop up as the number one listed in my sear for 2018 Federal Poverty Level. Some links don’t do as good a job explaining the FPL and can be a bit confusing for some.
Brian says
We have been cautious – probably over-cautious – so as not to exceed that 400% FPL threshold that you mention. We’ve purchased our health insurance through the Marketplace since its inception five years ago. We’ve been careful to tax-efficiently withdraw from our investments during this time – keeping a solid track on our MAGI the entire time.
When I read your narrative, about pulling money from your IRA to pay your medical bills, I knew exactly where you were headed. I thought, “Uh-oh. I’ll be he hit that 400% FPL limit!”
We were fortunate to have read a number of horror scenarios about this “cliff” as the ACA rolled out, and carefully set up our income and tax estimations every year to consider the various FPL thresholds.
Best of luck in keeping on top of this in future years.
Eric Gold says
Bottom line, the ACA credit is reduced as income increases.
I just call the effect an income tax. Even though it is not meant to be one, that is the effect for most taxpayers.
The tricky part is that a jump to a higher contribution rate tier is applied to the *entire* ACA AGI. Tiers are at 2x, 2.5x, and 3x of the household FPL. If you stay within the same contribution tier, any added income will incur at most 9.69% tax since that is the maximum contribution tier for eligible incomes.
It’s a bit of irony really, that people have misunderstood for years income tax brackets as applying to the entire income yet the ACA tax credit (reduction) does just that.
Brian says
Interestingly, if the initial MAGI estimate winds up being low (due for instance, to an income windfall late in the year), each FPL tier has a repayment limitation such that the entire amount of excess APTC may not need to be repaid. So, jumping to a higher contribution rate tier may not necessarily be a bad thing. In fact, it may net some positive income since the APTC repayment is limited. (But, stay away from the dreaded 400% FPL tier!) https://www.irs.gov/affordable-care-act/individuals-and-families/four-things-to-know-about-advance-payments-of-the-premium-tax-credit
Eric Gold says
I meant to add ..
This is the function for the ACA brackets:
=If(levelized>300,969,If(levelized>250,821+(levelized-250)*148/50,643+(levelized-200)*178/50))
The function returns a value that when divided by 10,000 gives the contribution percent to apply to ACA AGI.
Levelized has to be calculated separately as the household FPL * 100
Eric Gold says
Example for above:
We are a two person household in Colorado, so our
FPL = 12,060+4180 = $16,240.
If our ACA AGI was $40k, our household FPL ratio is 40000/16240 = 2.463
Levelized then would be 2.463*100 = 246.
The ACA brackets in our case are at:
16240*2 = $32,480
16240*2.5 = $40,600
16240*3.0 = $48,720
16240*4.0 = $64,960
CORRECTION TO ABOVE POST:
The contribution percentage is always applied to the entire ACA AGI; the point here is that each bracket has a slope of either 148/50 or 178/50. The brackets are regressive.
Bruce Wilson says
This calculator looks interesting.
I have been looking for a calculator to help decide Roth conversions, whether to do them, if i do them, a plan to make them.
The best relatively simple one i found was on Schwab’s website.
Any other you might suggest for Roth decisions without the ACA piece?
Brian says
Having just reviewed this calculator and plugged in my own information, it looks as if this calculator can help with the Roth conversion question that you’re looking for. (The narrative above walks you through all that.)
The ACA piece is only one cell (Cell G31) that it pulls from the Form 8962 calculation (starting at Cell AC87). Simply disregard the single ACA piece (Net PTC) and what’s left is the regular tax portion impacted by the Roth conversion that you’re interested in.
Harry Sit says
If you don’t need the ACA piece you have many choices. All 3 calculators linked at the top will be able to do it. You run it once without Roth conversion (or converting a smaller amount). You write down the bottom line number or print out the results. You run it again with Roth conversion (or converting a larger amount). You look at the bottom line number and see how much more you will pay.
KD says
Harry, Please correct me if I am wrong. In the Calculations Tab of the spreadsheet, cell U48 shows you the marginal tax rate on ordinary income and cell U49 shows you the marginal tax rate on LTCG/QD. I checked it out and it seems to match a sample calculation I did that included ACA PTC effects. The marginal rate shown there includes effect of both, federal and state income tax.
Harry Sit says
KD – You are right. It calculates the marginal tax rates by increasing the ordinary income and long-term capital gains by $100 respectively. I only showed federal income tax in this post. The numbers in U48 and U49 include both federal and state. The state income tax is estimated from the state entry in H35.
MDM says
All correct. I find the marginal rate graph more useful but those two cells work as described.
MDM says
Harry, great article! I’ll probably link to it in the ‘Instructions’ tab when uploading a new version.
This spreadsheet started as a simple tool to help people organize their case study numbers for the mrmoneymustache forum, and has indeed grown over the years.
Updates are published in https://forum.mrmoneymustache.com/forum-information-faqs/case-study-spreadsheet-updates/. That’s also a good place (or PMing via the MMM forum) for people to report bugs, suggest enhancements, etc.
I also read the Bogleheads forum, and am happy to see it used there under the “personal finance toolbox” moniker.
In Excel (other programs don’t seem to work as well), the chart near cell J106 can show the various marginal rates in picture form.
Thanks again for the great write-up,
MDM
Harry Sit says
Thank you for the hard work in putting this together. It sounds like “Personal Finance Toolbox” isn’t the official name. Should it be called the “Case Study Spreadsheet” instead?
MDM says
Good question. 🙂
Case Study Spreadsheet is the original name, and fit the original purpose. Because its scope has increased over time, calling it Personal Finance Toolbox is not unreasonable.
Whatever one calls it, if it proves useful to people then I’m happy.
FinancialDave says
Harry,
I used this spreadsheet extensively (though not the ACA part) a few months back to understand the marginal rates as they apply to the decision on whether it makes sense to do Roth conversions, or contributions vs putting the money in traditional, when child tax credits and the “Savers credit” comes into the picture. The answer is much the same — you need to be careful when you are in these very nonlinear areas of the tax codes because you can easily make the wrong decision.
Charlie says
I just started playing around with this spreadsheet. A seemingly important data value is the SLCSP, which they don’t tell you until you receive your 1095 form in January. This is our first year in ACA, so the only thing I found was a tool on healthcare.gov to estimate the SLCSP for 2017 and a couple previous years. The amount calculated ($1,171) seems a little bit low to me as our 2018 bronze plan premium is over $1,400/month before APTC. If the SLCSP is wrong’, doesn’t that pretty much mess up this analysis?
Much of what I’ve previously read suggests to do as much Roth conversions as possible (of course without going over the subsidy cliff!) during the years before turning 70. Is that strategy not as desirable now because of the tax analysis contained in this spreadsheet??
Also, if you’ve already done some Roth conversion, it appears they can’t be undone in 2018 and future. So you really have to be careful and thoughtful in strategizing!
Thanks for this spreadsheet and all the great discussion!
Harry Sit says
The healthcare exchange usually lets you shop before you apply. You can see the prices of all Silver plans offered in your area. Put in an income above 400% FPL when you shop. Then use second lowest price for your calculation.
The equivalent additional tax from reducing your premium tax credit makes Roth conversion not as appealing than otherwise but that marginal tax rate may still be lower than the marginal tax rate you face after 70-1/2. You have to do the math and make some guesses. It’s not as clear cut as when you don’t need ACA premium tax credit.
Brian says
Each year during enrollment, after entering all the information they ask for, I snapshot and save all the relevant information for all the Bronze, Silver, and Gold plans. That way I’ve also saved the SLCSP and don’t have to wait until January for the 1095 Form. (I learned my lesson the very first year, in 2014, to archive as much as possible, just in case there’s a discrepancy.)
For us, the SLCSP estimator tool has almost always been wrong. (And the 1095 Form always matched the estimator tool.) But I always provided what I knew to be the correct SLCSP $ amount when I filed my tax return. Twice the IRS asked me for additional information regarding the SLCSP amount that I had filed. Twice they accepted my screen snapshot of that SLCSP for evidence.
You do have an alternative. If you go to https://www.healthcare.gov/see-plans/#/ and then click on (where it indicates in fine print) “Looking for 2018 Plans and Prices?” – you can re-enter your 2018 family/income information and then take a look at the 2018 SLCSP. When I try this method, it’s off by only 8 cents from the amount in the screen snapshot I had taken during enrollment.
Regarding Roth conversions, what I have concluded – feel free to correct me if I have this wrong – is that if I do a Roth conversion while receiving an ACA subsidy, given that my MAGI is so low now and the Roth conversions increases the MAGI, I then have to repay so much of the APTC subsidy to the IRS (even well before the “cliff”) that it doesn’t make the conversion financially worthwhile. Typically you would do a Roth conversion, being careful to remain in your tax bracket. But, the APTC subsidy payback is so much harsher, occurring before the tax bracket movement starts (unless you happen to hit one of the repayment limitation thresholds, then limiting how much of the subsidy you have to pay back). In any case, be cautious on this point. (Instead of using that spreadsheet for this Roth conversion estimation, I used my tax program from last year and simply entered multiple hypothetical Roth conversions in increments of $1K, and then charted into an Excel spreadsheet the resultant tax liabilities for each increment. Gives a close enough estimate.)
Best of luck for you on this topic.
(We’ve been on Exchange ACA Silver HMO insurance since it started in 2014. Next year we move briefly to an HDHP w/HSA and then on to Medicare & all the issues related to that.)
Charlie says
Harry and Brian, thank you for that very valuable SLCSP methodology! As I mentioned above, the online tool gave me a result of $1,171. When I went back into 2018 plans for our ages/location, the SLCSP was actually $1,786, over $600 higher. That changes the game around for sure and I’ll play with the spreadsheet some more and also try out last years TTax program with overrides.
The screenshot suggestion is excellent as well. The fact the IRS questioned your number vs. Form 1095 and accepted yours is very useful info.
Many thanks!
Eric Gold says
I use my local state marketplace but I imagine that other states and the federal are similar: I set my tax credit monthly use to zero and can then see the actual premium cost of the plans. This lets me identify my SLCSP and choose a bronze plan that leaves enough tax credit for dental.
By the way, note Harry’s choice of a plan with HSA eligibility.
Charlie says
Interestingly, the 1095 I just received for 2018 nailed the SCLSP amount to the penny! That was a nice surprise and it will be a pleasure to not have the IRS ask about any discrepancies.
The spreadsheet was most helpful in doing sensitivity analysis before end of year. I purchased TurboTax in December to help. I was comparing the results between the two and they tracked very nicely.
Like Harry, we chose an HSA compatible plan which allowed for up to $7,900 contribution for 2018 (can be made up through April 15th, 2019). The HSA contributions are both tax deductible and reduce MAGI for ACA purposes.
Chris says
Brian, yesterday I called the marketplace helpline at healthcare.gov to try to get my 2020 SLCSP. The agent I spoke to had no idea what I was talking about and I had to explain what SLCSP is to her about 5 times before she told me she had no way to obtain that information. I asked for a supervisor, who did know what SLCSP is but told me I just had to wait for the 1095 form in January. Luckily, I subsequently reviewed the comments here and used your link. Maybe you could offer some training over there?
Kevin says
I have a question I hope someone can answer. When I looked at my 2017 tax return form 1095 lists SLCSP as $1,366.31 yet there was only one option for a silver plan for my county and that premium was $1,596.26. A difference of $229.85 per month or over $2500 per year! For 2018 and 2019 I still only have one silver plan available.
If I have only one silver plan available why isn’t the SLCSP the same as my premium for my silver plan?
That year they also made a mistake in my 1095 form and forgot I had a spouse and to include her part of the premium. My accountant didn’t even catch it and I had to apply for a new form 1095 before I could have my taxes done.
Chris says
Is it too late to comment on this article? I just realized I screwed up and did too large of a Roth conversion. I did just under $50,000 because I had very little income in 2019 and am head of household with 1 child. I was expecting to get taxed at the 12% rate. Instead I owe $9,987 in federal tax. Putting different numbers in my tax program, if I had only done $47,000, it goes down to $5,197 and if I did $30,000, it would only be $2,012. I don’t suppose there are any programs in this covid-19 time that would allow me to change my conversion amount or do anything else to lower this tax bill?
David Folts says
If you need to bring your MAGI down $3,000, have you considered buying and then selling a stock for a $3,000 capital loss? Given the volatility in the market, perhaps this is an option to consider.
Bruce Wilson says
Chris, I am not an expert, but I do not believe you can undo the Roth conversion.
Up until a year or so ago you could, but the Secure Act changed that because some people were abusing the system.
The only thing I can think of to possibly lower your taxable income would be to do a Traditional IRA contribution for 2019. You can only contribute IF you have earned income like from a job. It would be the box 1 number on your W-2. The max you can contribute would be $6,000 if you are under 50 years old. You could contribute $7,000 if over 50 years old. If your box 1 number is say $4000 that would be the max you could contribute, regardless of age. Whatever amount you contribute would lower your taxable income by that amount. If you do this make sure you are contributing for the 2019 year.
Hao says
Hi Harry,
Thank you for your helpful articles regarding ACA health insurance & tax optimization. I am researching for the future and your articles help me understand bit by bit the complicated process. I greatly appreciate your scenarios and conclusion, “… converting to Roth or realizing long-term capital gains while receiving the health insurance subsidy from ACA will incur higher federal income tax than if you are not receiving the health insurance subsidy”. Your article helps improve tax planning.
David Gilmer says
Hi Harry,
Using the 2021 spreadsheet to repeat your results, I get the same bottom line of $488 of tax but the TIRA withdrawal chart is completely different, starting at near zero, then near 12%, then up to 22% like I would expect.
Maybe, they reworked the math, as your chart makes no sense. The first clue is the cumulative tax should not slope down. Tax will always be added as more income is added by the amount the ACA subsidy goes away and the amount of extra tax added by the withdrawals??
Try it maybe he changed how the chart works.
MDM says
“Cumulative” refers to the average tax rate, not the tax amount.
Davidson says
I’m looking at a tax bomb of deferred savings bond interest. I’m wondering could I just use the chart for this as well as the stated purpose?
I’m having a bit of an issue trying to understand the new graph he uses, perhaps I could post a link to my personal Sheets spreadsheet?
I’m wanting to do something while the “cliff” is not used for 2024/5
Harry Sit says
Savings bond interest is exempt from state income tax. If you only look at the effect on federal, it has the same effect as a Roth conversion.
MDM says
Unfortunately the charts in the CSS don’t work with Google Sheets. At least, nobody has provided “how-to” information. See https://forum.mrmoneymustache.com/ask-a-mustachian/any-google-sheets-knowledge/.
Michael Lydon says
it’s July 2025. has this been updated?
MDM says
The spreadsheet includes TY2025 calculations. Don’t know if the screen shots are still 100% accurate, but at worst there’s probably only a single row or column difference and it should be very clear what is meant. TY2026 calculations will have to wait until the dust settles….
M says
can you please address whether Roth withdrawals before age 59 1/2 have any impact here? Specifically withdrawals of Roth contributions, rather than any interest earned on those contributions. Although it would be nice to see the results of both.
Also and more generally, do Roth withdrawals after age 59 1/2 impact any of this, whether of Roth contributions or interest/gains?
M says
also another specific example: assume age 58, single no dependents, no other income (to simplify) and ACA at max benefit. Roth conversion of approx 20k in January, and Roth withdrawal of only this ‘contribution’ for income. impact on ACA ? tax rate?
Harry Sit says
Roth withdrawal before age 59-1/2 of only the direct contributions (not conversions) are tax-free and penalty-free. It doesn’t count toward the AGI and it doesn’t affect anything here.
Withdrawing before 59-1/2 a converted amount isn’t taxable but is subject to a 10% penalty if the conversion hasn’t aged for five years yet.
Earnings (whether on direct contributions or converted funds) withdrawn before 59-1/2 are taxable plus a 10% penalty.
Roth withdrawals after 59-1/2 are tax-free and penalty-free if the first Roth IRA was opened at least five years ago.
See a handy chart here: https://www.bogleheads.org/wiki/Roth_IRA#Distributions
In your example, the 58-year-old first pays tax to convert $20k to Roth. Withdrawing the $20k from the Roth IRA in the same year isn’t taxable again but it will have a 10% penalty. It’s the same as not going through the conversion step and withdrawing directly from the Traditional IRA. The impact on taxes and the ACA premium will be the same as shown in the spreadsheet plus 10%.